USD/SGD Weekly Analysis for Singapore Broker
Contents
Introduction
Markets in Asia trend lower this Monday, and currencies, on the other hand, are in a range at the moment, as we enter a week scheduled with a number of central bank meetings.
U.S Fundamentals
Talking about meetings, United States Federal Reserve has meetings scheduled for Tuesday and Wednesday. Despite last week’s disappointing quarterly earnings from tech companies such as Facebook Inc., Twitter Inc., and Intel Corp the S&P 500 and the Dow Jones closed the week stronger.
Singapore Fundamentals
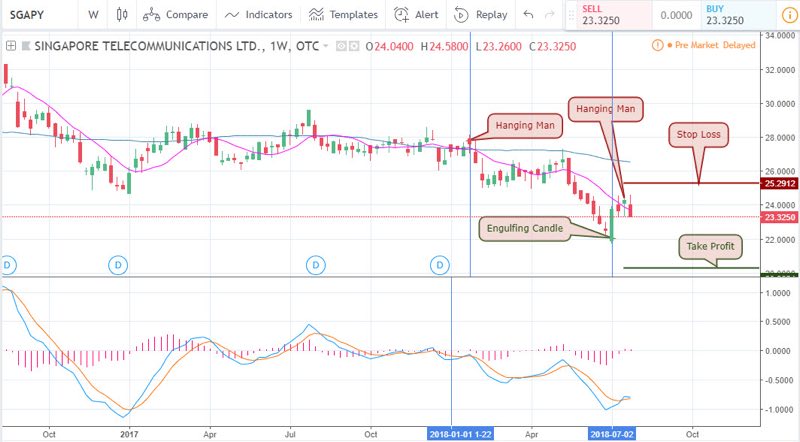
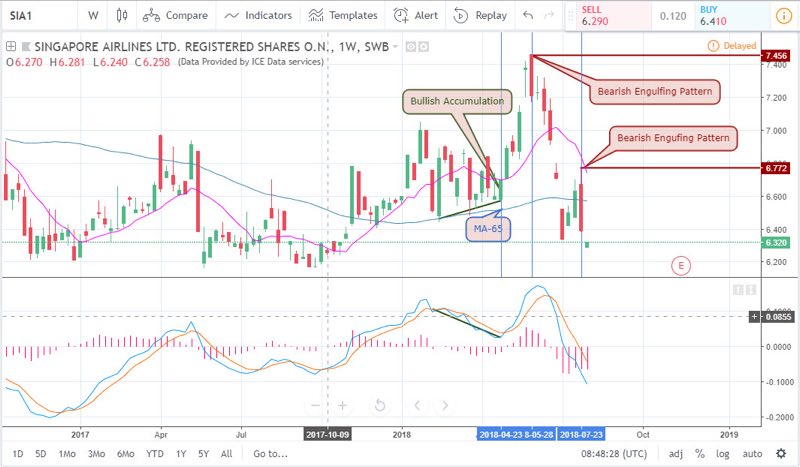
This week we decided to get the price data of a few shares in Singapore. They include Singapore Telecommunications LTD OTC and Singapore Airlines.
Both showed an optimistic recovery on 09-07-2018, but moving forward, last week the share price plummet and we expect this week to continue in the bearish direction.
Below is the time series chart of both the Singapore telecommunications LTD and the Singapore Airlines.
Technical
Is there any hope of recovery in the price of the SGD to USD? Let’s do a top-down multiple time frame technical analysis on the pair to gain insights into how this week will play out.
USDSGD: Monthly Chart
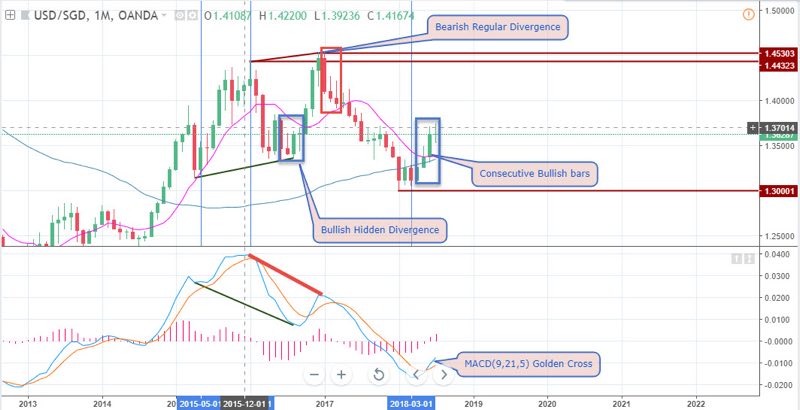
Nothing much has changed since our last review of the monthly charts. The pair still remains in a consecutive bullish candlesticks formation, after moving out of consecutive bearish bars that lasted between 01-06-2017 and 01-03-2018.
USDSGD: Weekly Chart
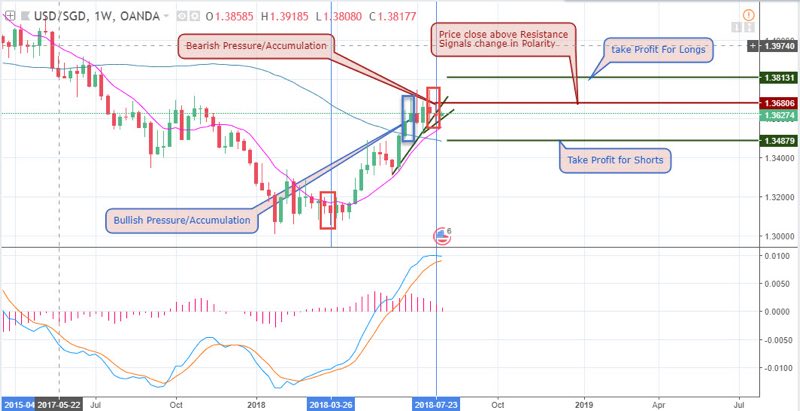
On the weekly chart shown above, the trend buildup becomes more relatable, making for timely and clear decision making processes. The closer bars to present week are currently in an upward rising triangle. A setup to be mindful for though is the bearish accumulation pattern. Using the bearish and bullish accumulation patterns on the chart, we are able to establish reliable support and resistance levels.
USDSGD: Daily Timeframe
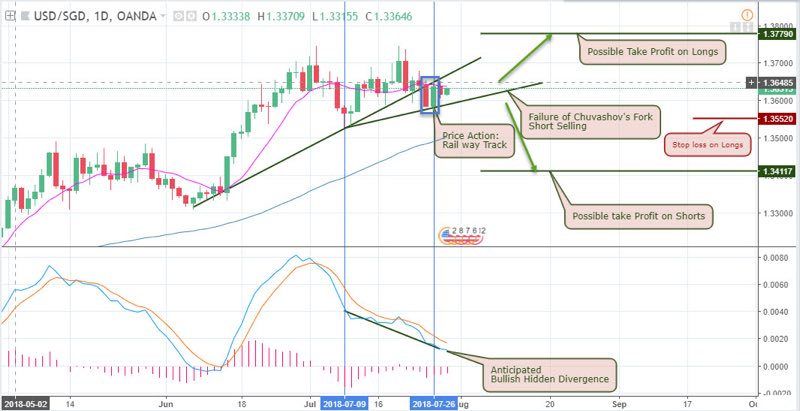
Attached above is the daily chart illustrating important price action and chart patterns. Among these patterns are the Railway track, Chuvashov fork, and a bullish hidden divergence in view. A price close below the second trend line signals a bearish trade. This may align with the bearish accumulation price action pattern on the weekly chart. On the other hand, the railway track pattern and anticipated bullish hidden divergence patterns have good chances of breaking the pair out of its current triangle.
USDSGD: 4-HOURLY Timeframe
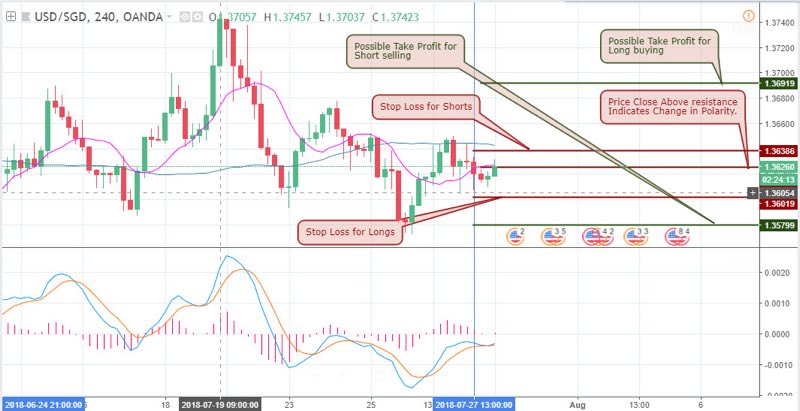
Here, the pair experiences a lot of swings which is something swing traders are fond of. Getting a clear overview on the way this week will turn out is something the 4-hour chart is good for, but we can’t do it in isolation of the higher timeframes.
The pair is currently in a bearish accumulation pattern, which implies a downward continuation. A failure of this pattern towards the upside triggers a buy order. Take profit points for both Long and Short positions are 1.36919 and 1.35799 respectively.
USDSGD: 2-Hour Chart
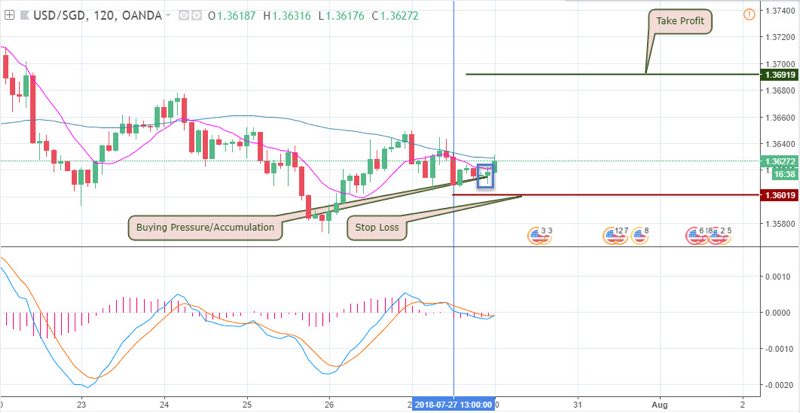
Looking for quick scalping opportunities, the above chart presents such opportunities. Compared to the 4hour chart, this 2hour chart shows buying pressure. Entering a long position at the current price is not complete without the stop loss at 1.36019 and profit target at 1.36919.
Projection and Conclusion
Okay, looking at the fundamental events lined up for this week, plus the daily and 4hour chart technical analysis, we’ll want to conclude by saying this week is most likely to be an upward moving rollercoaster. Should the bullish hidden divergence setup hold, our price target of 1.37790 is highly probable; otherwise we have a stop loss order in place for damage control. Say you are a resident of Singapore and considering a broker to trade this pair, I will recommend a Singapore broker considering that you experience their physical presence and confidence your capital is in safe hands.
Our Recommended Singapore Broker to trade USD/SGD
Best Regulated Broker: IQ Option

IQ Option is the world’s leading EU regulated financial broker based with a revolutionary platform for all traders. Very popular for crypto and USD/SGD trading. Read IQ Option Singapore review
- Best Trading App for Binary Options
- Minimum Deposit of only $10
- Minimum Trade of $1
- Trusted Broker
- $10,000 Virtual Funds ( Demo Account )
- Quick Withdrawals
- Outstanding Platform
- Weekly Tournaments
- Gain up to 98%*
Best Binary Options Broker: Olymp Trade

Olymp Trade is an award winning binary options broker with an excellent trading platform support and education tools. Read Olymp Trade Review
- Risk-Free Trades
- Minimum Deposit of only $10
- Max. 90% Payout
- $10,000 Free Demo account
- Free TrainingEducation : 18 Indicators, 7 strategies and 28 webinars 25% Deposit s
- Certified Platform
- Quick withdrawals
Best Binary Bonus: Binomo

Binomo is a regulated binary broker with a wide range of assets to trade and amazing promotions ( bonus, tournaments prizes,..) .Read Binomo Review
- 25% Deposit Bonus ( 100% Bonus VIP accounts )
- Minimum Deposit of only $10
- Minimum Trade of $1
- Max. 95% Payout
- $1,000 Virtual Funds ( Demo Account )
- Weekend trading
- Free training
DISCLAIMER

- EURUSDWeekly outlook – 7th January 2022 - January 7, 2022
- BTCUSD – Weekly outlook for Bitcoin Price – 23rd December 2021 - December 24, 2021
- USDSGDWeekly outlook for Singapore Dollar – 17th Dec 2021 - December 17, 2021
Tagged with: singapore broker • usgsgd

