USD/SGD Weekly Analysis for Singapore Brokers
Contents
Introduction
From the regular divergence pattern on 2017-01-02, the USDSGD currency pair went into a bearish trend with the Singdollar strengthening. If you are new to the trading industry, you may find it difficult to decipher where this move will end, what factors are currently affecting the pair and how to identify an opposite directional trend. Read on as we highlight the latest happening that are currently affecting the SGD to USD exchange rate.
Fundamentals
U.S Fundamentals
Closing bullish in a consecutive 3-month rise, the USD index made an additional increase of 5.2% following a similar occurrence in 2016. Similarly, between the months of March till June, the Atlanta Fed stated that the United States GDP increased at about 3.8% rate. President Trump again on Sunday equates the EU to China, stating that they both hinder U.S. trades. As a reaction to this, the EU has threatened a $300 billion fresh tariff on products from the United States.
Singapore Fundamentals
According to Singapore’s Prime Minister Lee in a Reuter interview, the Asian Tiger is a global hub that links the United State and Chinese economies, so a trade war between these two giants will have a huge negative impact on the Singdollar.
Technical
Making reference to our previous post on the 4th of last month, the exchange rate of SGD to USD continued in an upward trend as our anticipated hidden divergence got triggered. Following the path of a multiple time frame analysis, we’ll start from the Monthly chart for clarity of the general trend direction, as we zoom inward for clear entry setups.
USDSGD: Monthly Chart

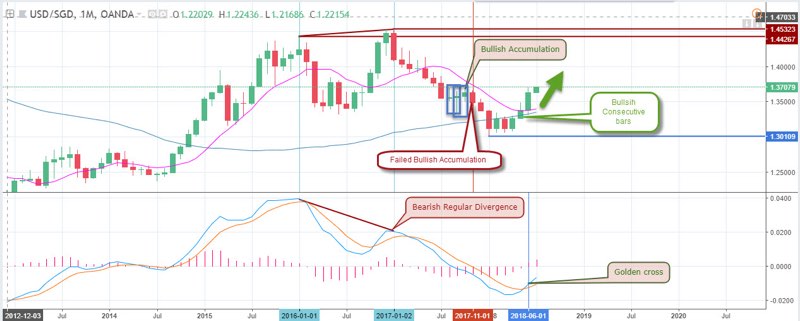
After a bearish regular divergence pattern formed on 02-01-2017, the Singdollar strengthened against the U.S dollar for about 12 months. The golden cross of the MACD oscillator attached to the price chart signals an end to this bearish decline of the pair, hence confirming the consecutive monthly bullish candlesticks as shown above. This is an indication of huge speculative demand for the United States dollar by Singapore broker/s and traders.
USDSGD: Weekly Chart

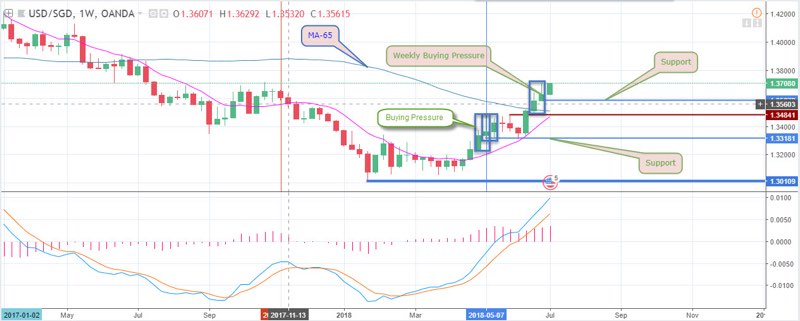
The above weekly timeframe offers a clearer illustration of price dynamics of the monthly chart. 07-06-2018 indicated 3 consecutive bullish bars that signalled huge buying pressure. An opposite 3 weeks of retracement couldn’t violate the established support level of 1.33181. The pair used this level as a springboard and sends the exchange rates higher.
USDSGD: 4-HOURLY Timeframe

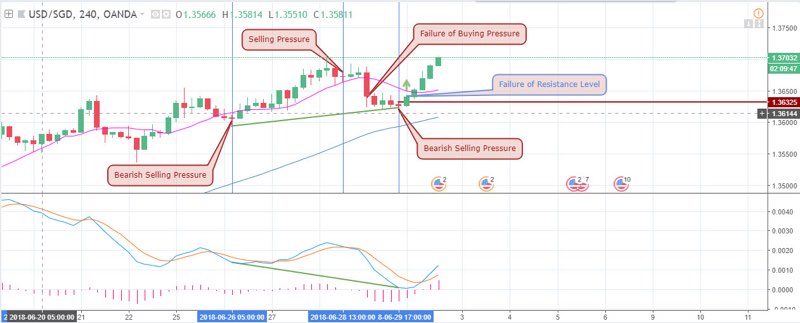
Zooming closer to the 4-hour time frame, the above chart illustrates how a bearish accumulation phase (2018-06-29 17:00) failed, consequently leading to a change in polarity. A price close above the resistance price of 1.36325 switched the price level from resistance to a support. This gave rise to consecutive bullish 4-hourly bars.
USDSGD: 1-Hour Chart

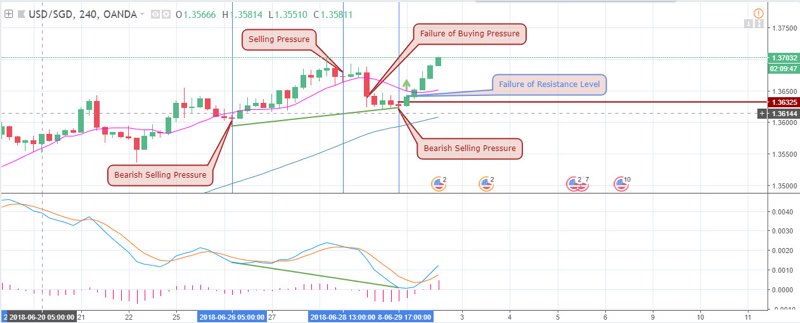
Above is the 1-hourly chart which illustrates a most reasonable and closest zoom for the USDSGD pair. A bearish regular divergence pattern at a selling pressure triggers the downward trend correction that took place towards the end of June. A failure of selling pressure, triggered by hourly price close above the resistance level on (2018-07-01) confirms the intermediate bearish trend.
Projection and Conclusion
This week, the dollar is expected to continue its dominance against the Singdollar considering the above fundamental and technical reasons. Although the 4-hour chart which gives a better perspective of this week’s direction is currently in a bullish trend; we shouldn’t be surprised if there is a mid-week correction owing to anticipated bearish regular divergence on the 4hourly chart. Intraday swings are expected as Wednesday 4th of July holidays often comes with low trading volume.
Our Recommended Singapore Brokers to trade USD/SGD
Best Regulated Broker: IQ Option

IQ Option is the world’s leading EU regulated financial broker based with a revolutionary platform for all traders. Very popular for crypto and USD/SGD trading. Read IQ Option Singapore review
- Best Trading App for Binary Options
- Minimum Deposit of only $10
- Minimum Trade of $1
- Trusted Broker
- $10,000 Virtual Funds ( Demo Account )
- Quick Withdrawals
- Outstanding Platform
- Weekly Tournaments
- Gain up to 98%*
Best Binary Options Broker: Olymp Trade

Olymp Trade is an award winning binary options broker with an excellent trading platform support and education tools. Read Olymp Trade Review
- Risk-Free Trades
- Minimum Deposit of only $10
- Max. 90% Payout
- $10,000 Free Demo account
- Free TrainingEducation : 18 Indicators, 7 strategies and 28 webinars 25% Deposit s
- Certified Platform
- Quick withdrawals
Best Binary Bonus: Binomo

Binomo is a regulated binary broker with a wide range of assets to trade and amazing promotions ( bonus, tournaments prizes,..) .Read Binomo Review
- 25% Deposit Bonus ( 100% Bonus VIP accounts )
- Minimum Deposit of only $10
- Minimum Trade of $1
- Max. 95% Payout
- $1,000 Virtual Funds ( Demo Account )
- Weekend trading
- Free training
DISCLAIMER

- EURUSDWeekly outlook – 7th January 2022 - January 7, 2022
- BTCUSD – Weekly outlook for Bitcoin Price – 23rd December 2021 - December 24, 2021
- USDSGDWeekly outlook for Singapore Dollar – 17th Dec 2021 - December 17, 2021

