USDSGD Technical Analysis for Singapore Brokers
Contents
Introduction
With public places shut down in major cities across the globe due to the spread of the COVID-19 virus, traders and investors, including those trading on IQ Option broker platform, turn to the USD as a haven currency for uncertainties that comes later.
Should we look forward to a slowing or continuation of the price rally, or will the bears resume control of the exchange rate this week into the next?
Read on as we analyze the charts from a top-down approach and go over some fundamental indicators in the United States and Singapore.
Singapore Consumer Price Index (CPI)
Singapore CPI is a major index used in determining the change in inflation and purchasing sentiment.
The CPI evaluates the change in the price of goods and services, with the consumer’s perspective in mind.
A lower than expected data is rated bearish for the currency, whereas a bullish opinion can be presumed for the currency when the data study is more leading than anticipated value.
The latest data released on February 24 indicates that a bearish outlook expected for the USD as the actual reading is 0.8%, the previous reading is 0.8%, and the forecast data value is 0.9%.
U.S. Existing Home Sales
Existing Home Sales Index is a report that considers the changes in the number of existing residential constructions sold during the previous month.
The report is a crucial indicator of overall economic health and helps to gauge the strength of the U.S. housing market.
A lower than expected data is rated bearish for the currency, whereas a bullish outlook can be supposed for the currency when a data value is higher than the expected value.
The latest data released on February 21 indicates that a bearish outlook expected for the USD as the actual reading is 5.46M, the previous reading is 5.53M, and the forecast data value is 5.43M.
USDSGD Technical Analysis
USD/SGD Long term Outlook: Bullish
Monthly Chart

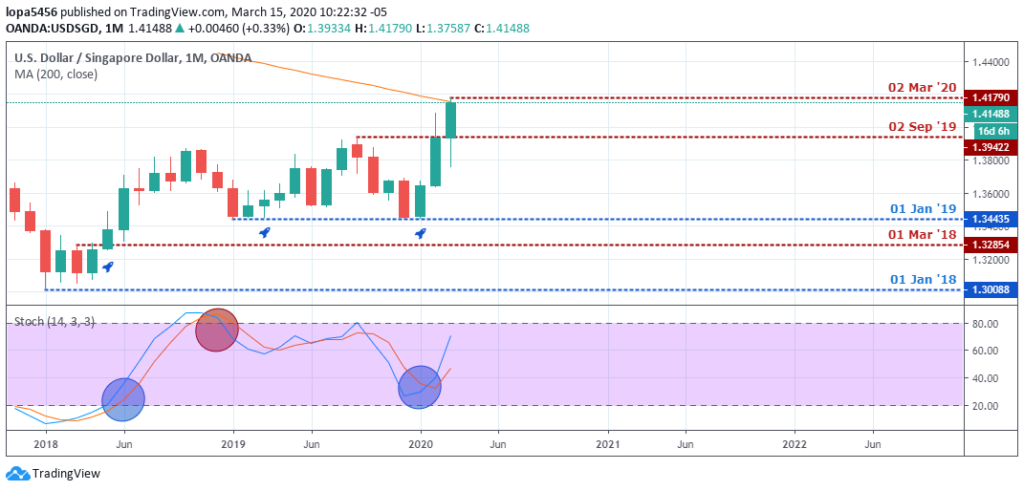
After stalling around the 200-MA, the bears showed little confidence to find resistance at the significant Moving Average.
However, an increase in buying power sends the USD to SGD exchange rate shooting above the Moving Average resistance. The USD has now become a haven pair as the global death rate of coronavirus increases.
Weekly Chart

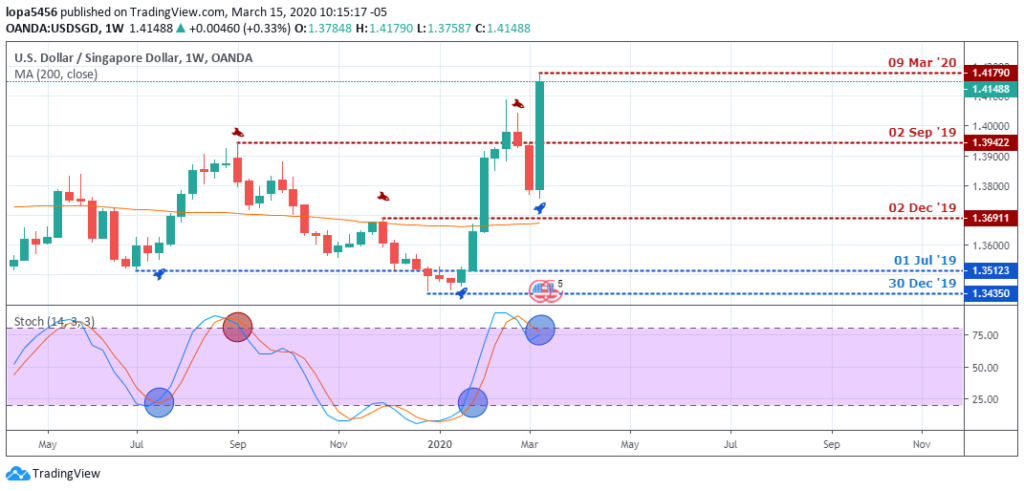
The USDSGD foreign exchange began its’ journey into a bullish trend after finding support at 1.34350 from a bear trap candlestick formation on 30 Dec ’19.
An exit of the overbought area and a later break above the 02 Sep ’19 resistance was proof that the bulls are still in control of the market as the price soared higher into the week for an extra 2.92% increase from the opening price.
USD/SGD Medium Term Outlook: Bullish
Daily Chart

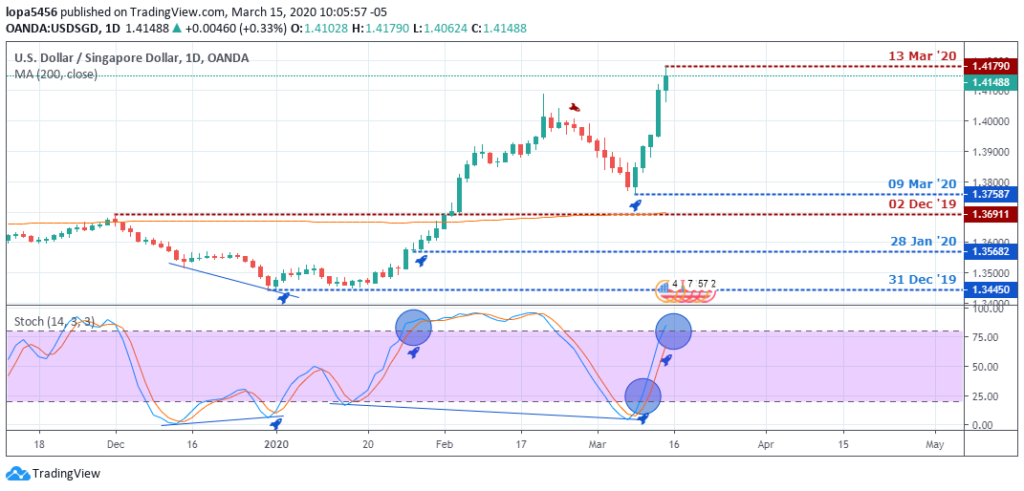
After finally closing above the 200-MA on 03 February ’20, and entered the overbought area, the USDSGD exited the zone from a daily time view and corrected the gains into the oversold region.
Upon exiting the oversold area and finding support on the previously broken MA-200 on 10 March ’20, the bulls resumed control and forced the price to a current price high at 1.4568 2.68% beyond the 1.4179 high on the chart above.
H4 Chart

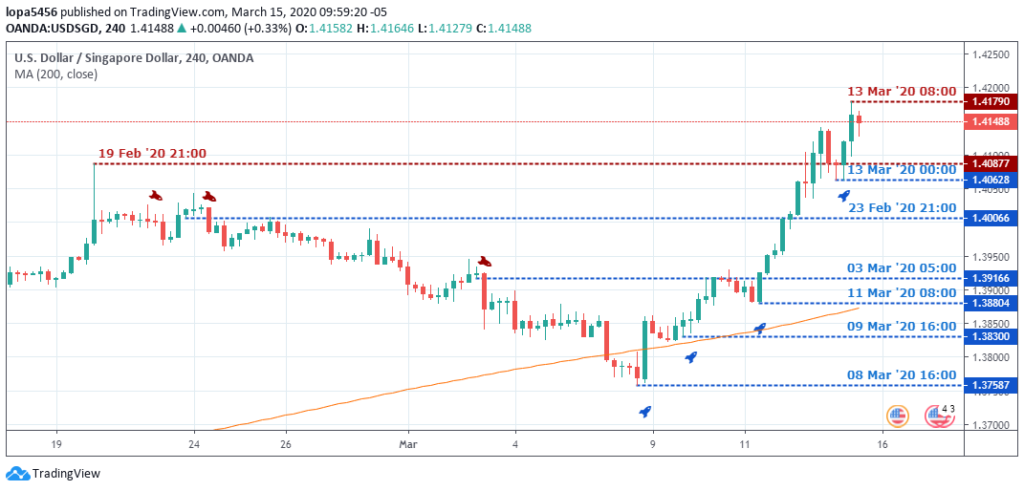
Notice a sequence of failure swings in the form of accumulation of buyers on 23 February ’20 21:00 and 03 March ’20 05:00 that resulted in a bearish swing for a price plunge below the 200-MA.
After closing back above the 200-MA, the bulls assumed control of the market by forming higher lows on 09 March ’20 16:00, 11 March ’20 08:00, and 13 March ’20 00:00.
Conclusion
Although the United States Dollar from the daily TF of the USD Index makes a deep correction, it continues to show strength and a have to hedge against risk in an uncertain economic situation caused by the coronavirus outbreak.

- EURUSDWeekly outlook – 7th January 2022 - January 7, 2022
- BTCUSD – Weekly outlook for Bitcoin Price – 23rd December 2021 - December 24, 2021
- USDSGDWeekly outlook for Singapore Dollar – 17th Dec 2021 - December 17, 2021

