USDSGD Technical Analysis for Singapore Brokers
Contents
Introduction
Welcome traders to a New Year and a new decade (2020)! Last year showed the Greenback showing confidence against the Singapore dollar on Binomo Broker, only to later lose all of that to an increase in demand for the Singdollar.
This week, we’ll be doing a recap of the technical patterns at play in 2019, and the likelihood of the continuation of the bearish trend.
Singapore Consumer Price Index (CPI)
The Consumer Price Index (CPI) is an evaluation of variations in the price of goods and services from the consumer’s perspective.
A higher than expected reading signals and should be interpreted as a positive or bullish outlook for the USD. In contrast, a lower than expected reading is interpreted as a negative or bearish sentiment for the currency.
Traders can expect a positive outlook for the USD based on latest data which reads thus;
Actual and forecast reading: 0.6%, and previous reading: 0.4%.
U.S. ISM Manufacturing Purchasing Managers Index
The ISM Manufacturing Purchasing Managers Index (PMI) Report on Business is a composite index compiled from data based on seasonally adjusted diffusion indices for five of the indicators with varying weights. These indicators are New Orders, which accounts for 30%, Production, which accounts for 25%, Employment –20%, Supplier Deliveries accounts for 15%, while Inventories is 10%.
A higher than anticipated reading is seen as optimistic and should be interpreted as a positive or bullish outlook for the USD. In contrast, a lower than expected text is interpreted as a negative or bearish sentiment for the currency.
Traders can expect a bearish outlook for the USD based on latest data which reads thus;
Actual reading: 48.1, forecast reading: 49.2, and previous reading: 48.3.
USDSGD Technical Analysis
USDSGD Long term Projection: Bearish
Monthly Chart

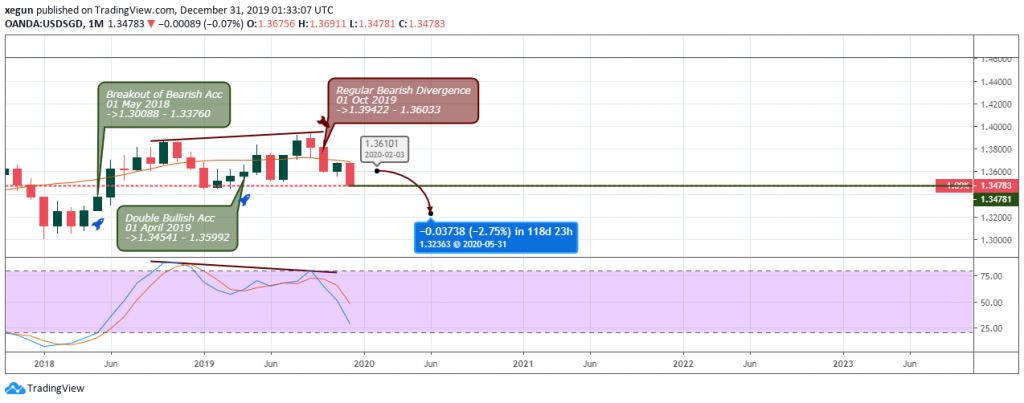
The USDSGD signaled a double bullish congestion pattern in the first quarter of 2019 for a price surge of about 2.5% before indicating a regular bearish divergence pattern in the Q4 2019.
The bearish price slump of the USDSGD highlights a stronger Singapore dollar compared to the USD.
Furthermore, if the pair fails to close below the 1.34541 support, we should expect a price recoil to the upside. However, the bears seem to have a firm grip on the pair through the regular bearish divergence setup, so we should expect a continuation of the price decline in Q1 2020, which may consequently move the stochastic oscillator into the oversold area.
Weekly Chart

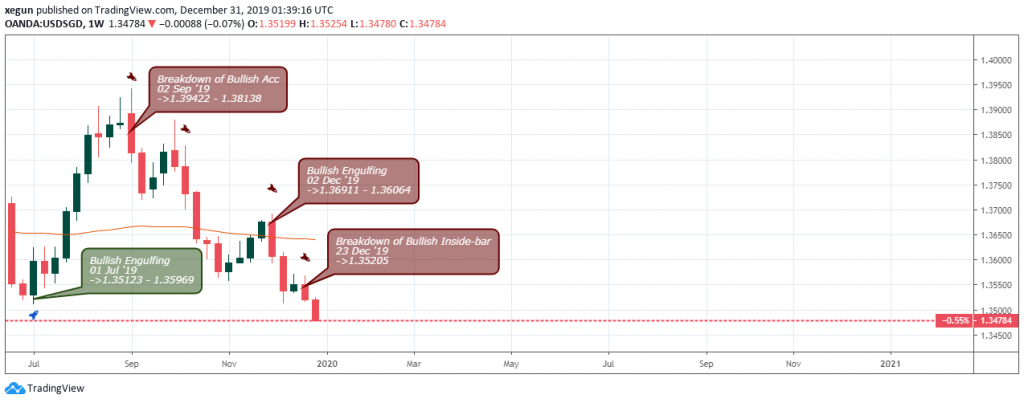
The weekly time frame unveils long and short entry setups that led to the parabolic formation of the USD to SGD in 2019.
The pair plummets all through the second half of last year and to the end of the year after a collapse of the foreign exchange bullish support on September 02 ’19 by roughly (-2.65%).
The failure of the bullish inside-bar support on December 23 confirms our bias to further short-sell the USDSGD pair into the end of the current week.
USDSGD Medium Term Projections: Bearish
Daily Chart

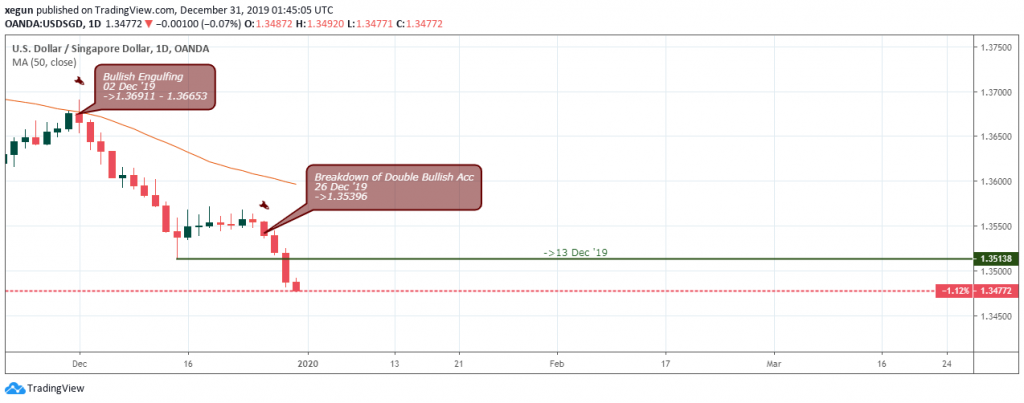
If you followed the USDSGD currency pair from a daily chart perspective, you’d notice the bearish engulfing candlestick formation that coincides with the MA-50 on December 02.
The bearish candlestick pattern showed an increase in strength of the Singapore dollar as it again broke below significant support levels on December 26, after the Christmas holiday.
Conclusion
Following the analysis above, the USD shows strong bearish sentiment into the New Year. There’s currently no bullish technical setup to suggest a reversal or bottoming of the bearish trend.
Therefore, we expect the bearish trend to continue south throughout this week.

- EURUSDWeekly outlook – 7th January 2022 - January 7, 2022
- BTCUSD – Weekly outlook for Bitcoin Price – 23rd December 2021 - December 24, 2021
- USDSGDWeekly outlook for Singapore Dollar – 17th Dec 2021 - December 17, 2021

