USDSGD Technical Analysis for Singapore Brokers
Contents
Introduction
It’s the third week in January, and the USDSGD maintains a bearish outlook across Singapore brokers platforms.
Read on as we uncover the technical drivers of the exchange rate and some underlying fundamental indicators.
Singapore Non-Oil Exports
Exports of goods and services involve transactions in products and services (barter, sales, gifts, or grants) from residents to non-residents.
We can expect a bullish sentiment for the currency when published data is higher than anticipated. However, if the published data reading is less than the value of forecasted data, then we can envision a bearish outlook for the currency.
As a result of the above parameters, we can expect a positive outlook for the SGD considering data published on January 17, 2020. The data states that the actual and forecast reading is -5.90, while the previous reading -12.50%.
U.S. Philadelphia Fed Manufacturing Index
The Philadelphia Federal Reserve Manufacturing Index is an index that is determined by a survey of about 250 manufactures in the Philadelphia Federal Reserve district.
The index measures the comparative level of overall business conditions in Philadelphia.
If the level is below zero on the index, it indicates deteriorating conditions, while the conditions can be said to be improving if the level is above zero.
As a result of the above parameter, we can expect a positive outlook for the USD considering data published on January 17, 2020. The data states that the actual and forecast reading is -5.90, while the previous reading -12.50%.
USDSGD Technical Analysis
USDSGD Long term Outlook: Bearish
Monthly Chart

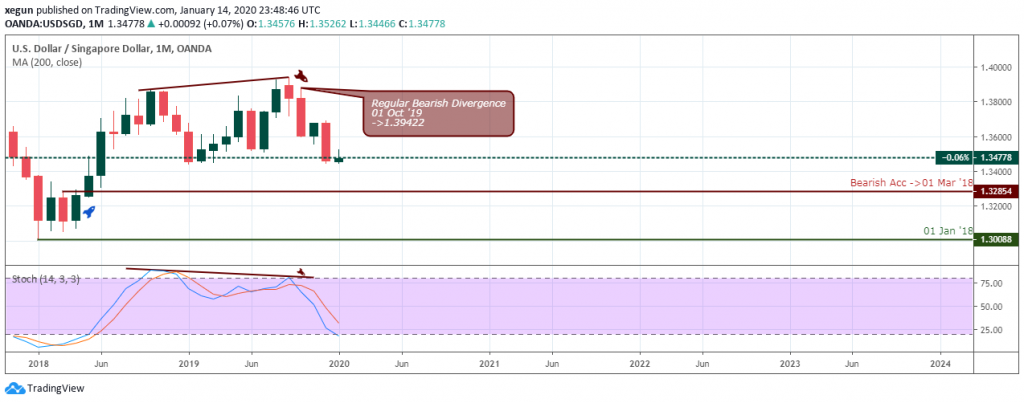
The regular bearish divergence of the stochastic oscillator signaled in October 2019 sets a bearish undertone for the USD to SGD FX pair.
So far, the price has slumped by 3.57% from the September 2019 high, and heads towards the March 2018 support.
At this point, the pair is projected to plunge into the oversold area and consequently close below the January 2019 support (1.34435).
Weekly Chart

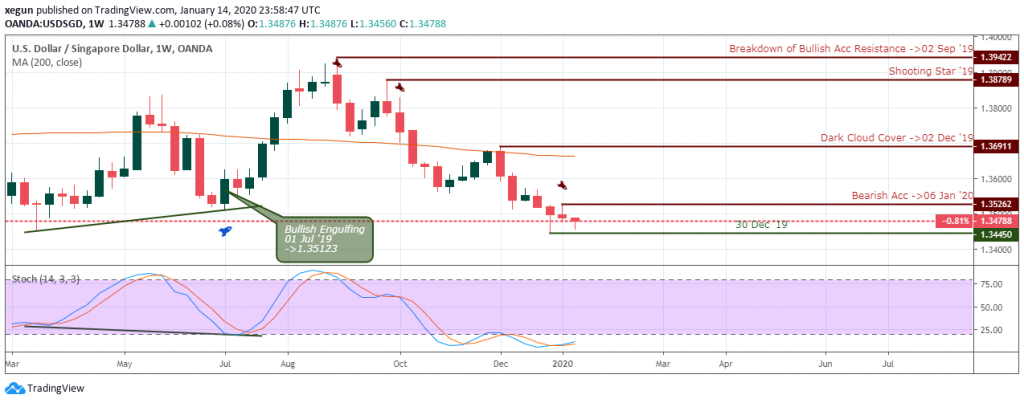
Upon the collapse of significant support on September 02, 2019, and a bearish close below the MA-200 on October 14, 2019, the 200-weekly M.A. served as a major resistance that brought the pair back into the oversold area.
A price close above the 1.35262 resistance should see the pair soaring high into a bullish trend. Meanwhile, the bears are in control of the market at publication time.
USDSGD Medium Term Outlook: Bearish
Daily Chart

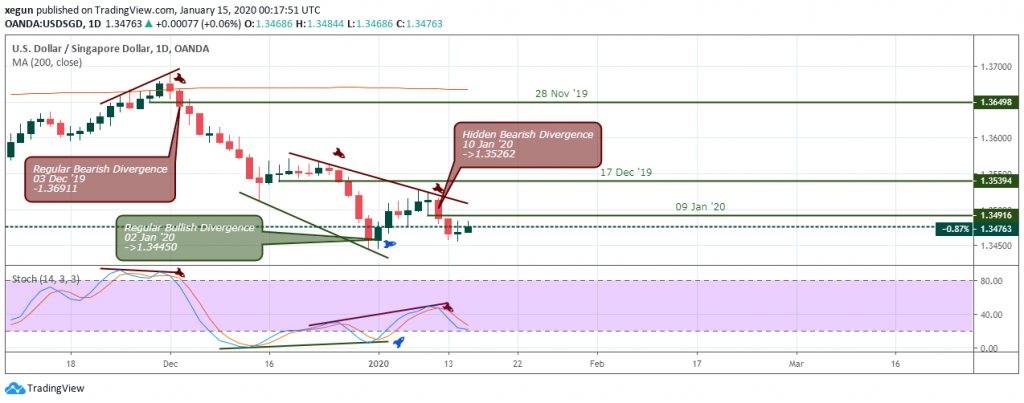
The above daily time frame, like the monthly chart, started with regular bearish divergence, however, on December 03, 2019, and slowly eased into an expanding bearish channel, which is again built off divergence patterns.
The more recent hidden bearish divergence setup signaled in combination with a collapse of 1.34916 support on January 10, 2020, hints on a continuation of the bearish trend.
H4 Chart

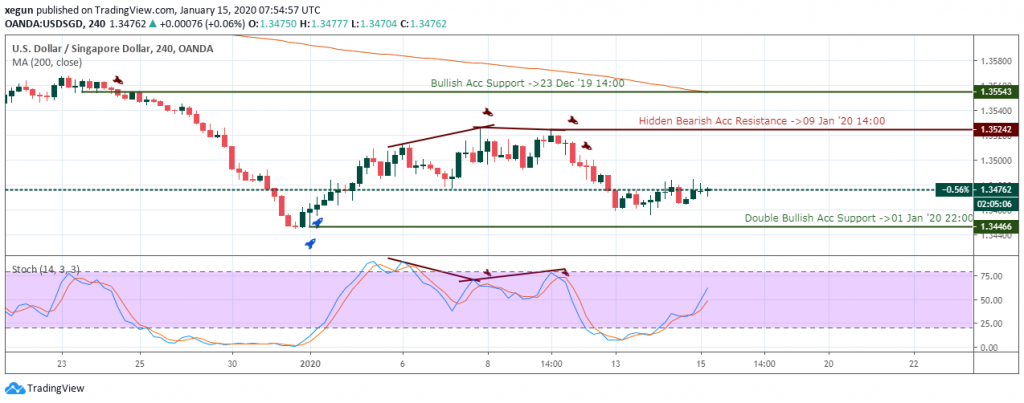
Rounding up with the 4hour time frame, the pair established a high at 1.35242, again through a series of regular bearish divergence patterns on January 08 and 09 2020.
Further collapse of significant support levels at 1.34684 and 1.34704, has rekindled the demand to resume the bearish momentum on major foreign exchange broker terminals, and therefore increasing the demand for Singapore dollar.
Conclusion
Finally, the Singapore dollar continues its dominance against the USD following the established resistance levels from our top to bottom multiple time frame analysis.
We look forward to a continuation of the bearish trend into the end of the week, and perhaps all through January.

- EURUSDWeekly outlook – 7th January 2022 - January 7, 2022
- BTCUSD – Weekly outlook for Bitcoin Price – 23rd December 2021 - December 24, 2021
- USDSGDWeekly outlook for Singapore Dollar – 17th Dec 2021 - December 17, 2021

