USDSGD Technical Analysis for Singapore Brokers
Contents
Introduction
This week marks the beginning of the second quarter Q2 2020, as traders and investors on OlympTrade broker sites look to scale into their open long positions.
In this post, we’ll identify the basic support/resistance levels across multiple time frames, zones, chart patterns, and macroeconomic events in Singapore and the US.
Singapore CPI (Consumer Price Index)
In Singapore, the CPI or Consumer Price Index plays a significant part in understanding the differences in purchasing trends and inflation in the country.
The CPI evaluates the changes in the prices consumers give out for a basket of goods and services. The index considers the consumer’s viewpoint.
A higher than anticipated reading should be taken as a positive sentiment for the Singapore dollar, while a reading less than expected is seen as negative for the currency.
Most recent data points to a bullish sentiment for the SGD as the forecast figure of the latest data reads 100.77 while the previous reading was 100.20, while the actual reading is 100.30.
U.S. Conference Board (C.B.) Consumer Confidence
The Conference Board Consumer Confidence index of the United States is an evaluation of consumers’ confidence level in economic activity in the U.S.
A greater than anticipated reading should be taken as a positive sentiment for the U.S. dollar, while a reading less than expected is seen as negative for the currency.
Most recent data points to a bullish sentiment for the USD as the forecast figure of the data reads 132.0, while the previous reading was 130.4 and the actual reading 130.7.
USDSGD Technical Analysis
USDSGD Long term Outlook: Bullish
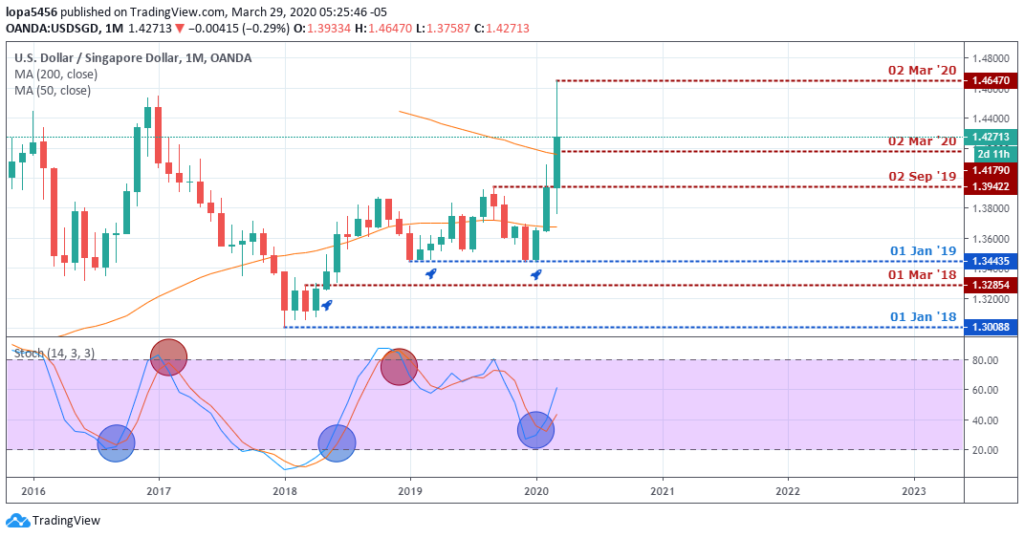
Monthly Chart

Resistance: 1.46470, 1.41790, 1.32854
Support: 1.34435, 1.30088
A bullish close above the 200-MA implies an increase in demand for the Greenback as the government of nations declares a curfew in their respective countries following an outbreak of the coronavirus COVID-19. Investors and traders generally seek shelter in the USD following a crash of the stock markets.
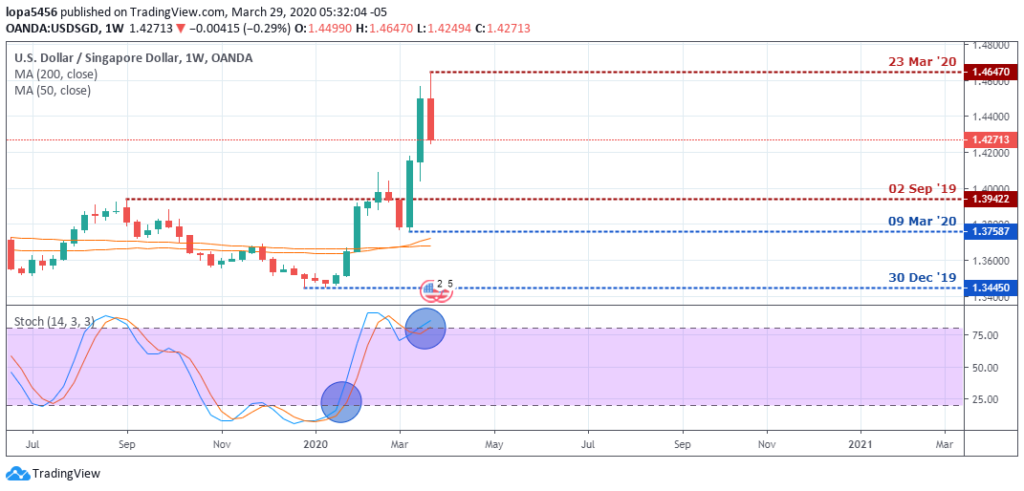
Weekly Chart

esistance: 1.46470, 1.39422
Support: 1.34450, 1.37587
Last week’s bearish price close suggested a slowing in bullish momentum. Meanwhile, an entry of the overbought area stresses bullish presence and a likely continuation of consecutive bullish closing candlesticks.
If the bulls succeed in moving the price above the 1.46470 resistance, then we should expect an extension of the bullish trend and a new all-time high established.
USDSGD Medium Term Outlook: Bullish
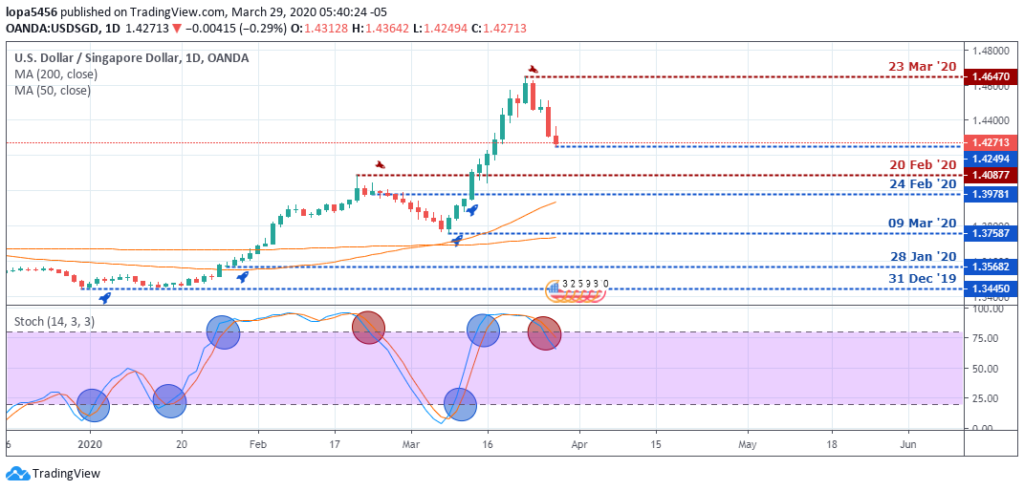
Daily Chart

Resistance: 1.46470, 1.40877
Support: 1.42494, 1.39781, 1.37587, 1.35682, 1.34450
An exit of the overbought area on the daily time frame shows the dynamics behind the bearish closing bar last week. It was simply a correction of the price surge, and a continuation is already on the way at press time.
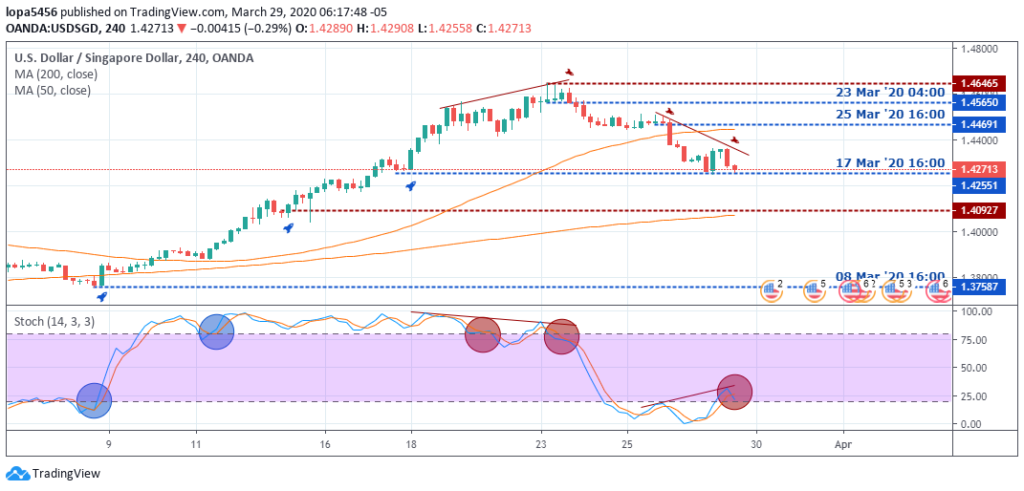
H4 Chart

Resistance: 1.46465, 1.40927
Support: 1.45650, 1.44691, 1.42551, 1.37587
Further down to the H4 time frame, a regular bearish divergence is identified as the culprit responsible for a correction of the bullish swing.
The most recent bearish divergence trend line failed to keep the price lower as the bulls forced their way above it to attain new highs.
Conclusion
A comeback of bullish momentum on the USD Index shows that we should look forward to an increase in the bullish trend of the USDSGD foreign exchange.
While buying the USDSGD, let’s ensure to activate a trailing stop order in these volatile times caused by the coronavirus outbreak, as we anticipate a bearish divergence may get triggered on the weekly charts going forward.

- EURUSDWeekly outlook – 7th January 2022 - January 7, 2022
- BTCUSD – Weekly outlook for Bitcoin Price – 23rd December 2021 - December 24, 2021
- USDSGDWeekly outlook for Singapore Dollar – 17th Dec 2021 - December 17, 2021

