USDSGD Technical Analysis for Singapore
Contents
Introduction
As the new month unfolds, the emerging markets in Asia, including the Singapore stocks, rose about 1%, which will boost the country’s foreign exchange as traders speculate on the top Singapore brokers.
The ISM in the USA manufacturing Industry will be releasing data on the industries’ performance levels, which will be closely monitored by investors who want to know their economic status.
Could it be that most economies are becoming more immune to covid-19 restrictions as growth is seen gradually from the survey?
Singapore Fundamentals
The Covid-19 pandemic second wave is coming with a cost as Exxon Mobil Corp will likely cut down the workforce by 7-8% in its oil and petrochemical sectors due to some business reviews to reduce carbon emissions as an international or global practice.
However, Asia’s regional manufacturing activities show progress in the recovery track as the bond markets ended the previous week’s bullish.
US Fundamentals
ISM Manufacturing
The survey was carried out among purchasing managers to evaluate the relative levels of employment, businesses, inventories, supplies, prices of goods, and production, among others.
From the outcome of the research carried out among the managers, a result above 50.0 indicates an industry expansion. In contrast, a result below 50.0 indicates a contraction in the manufacturing industry.
The Previous data was 58.7, and the forecast was 58.7. The Actual data came out 60.8, indicating the expansion in the manufacturing industry and businesses.
USDSGD Technical Analysis
USDSGD Long term Price Analysis
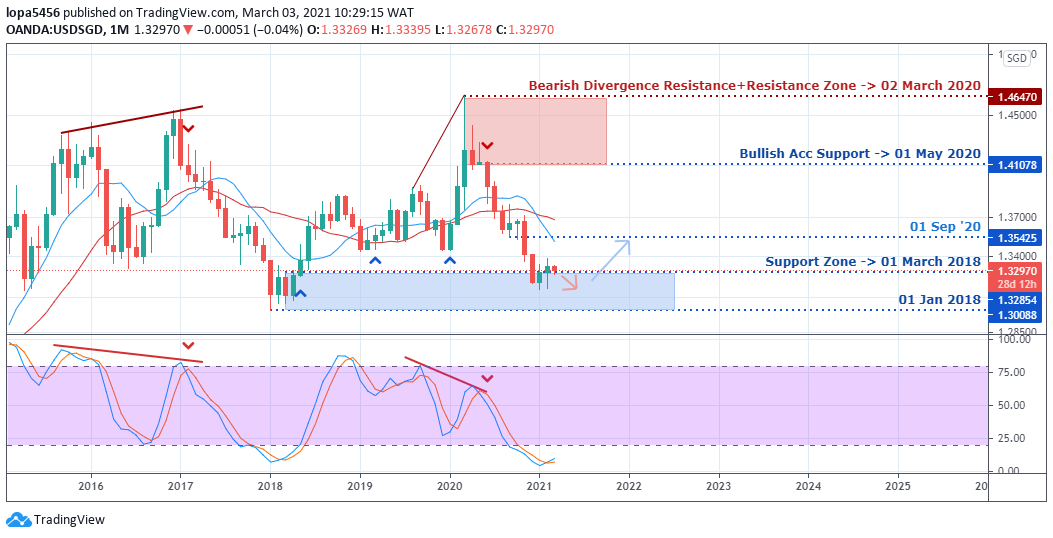
Monthly Outlook: Bearish Slowing
Monthly Resistances: 1.46470
Monthly Supports: 1.41078, 1.35425, 1.32854, 1.34000
The USDSGD pair has been bearish since the Bears took over from the resistance zones of 1.46470, which rejected the Bulls’ advancement as of March 2, 2020.
As you can see now, the support zones of March 2018 and January 2018 have been respected by price as the bearish move slows down around those levels.
Can we see the USDSGD foreign exchange bounce up from that level in the coming months? A strong bullish engulfing candle in line with the stochastic indicator will likely attract buyers into the market around the demand zones.
Weekly
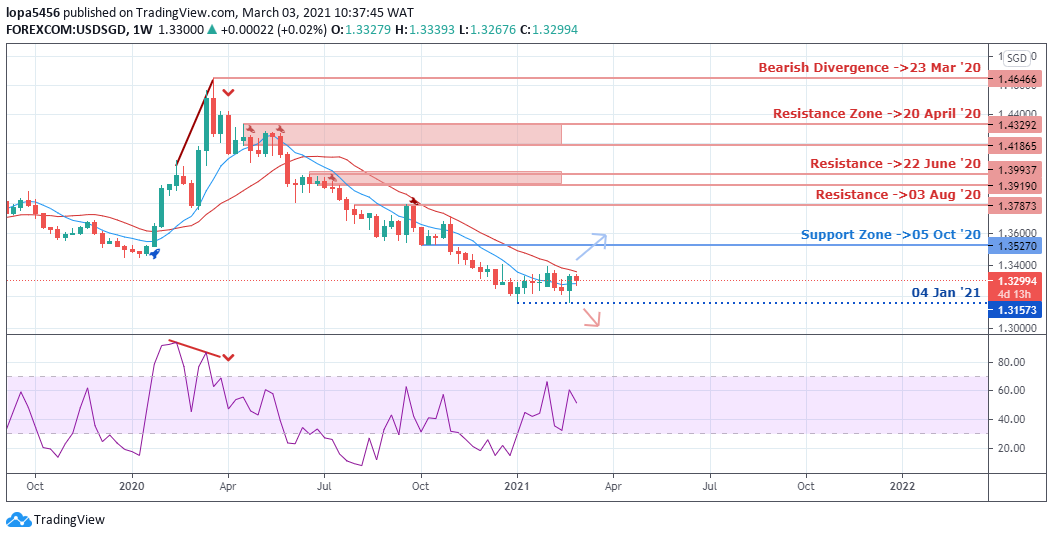
Weekly Resistance Levels: 1.33892, 1.35270
Weekly Support Levels: 1.31578, 1.32134, 1.31573
From the weekly chart, we can see that the bearish trend has been sustained right from March 23, 2020.
The USDSGD price has been creating lower highs and lower lows. Previously, the support level of 1.35270 was broken, which gave a downward surge, and the price is about to retest the level.
If we see a rejection of candles at that level, the price will test the 1.31573 level for a break or a bounce.
USDSGD Daily Time frame Outlook: Bearish
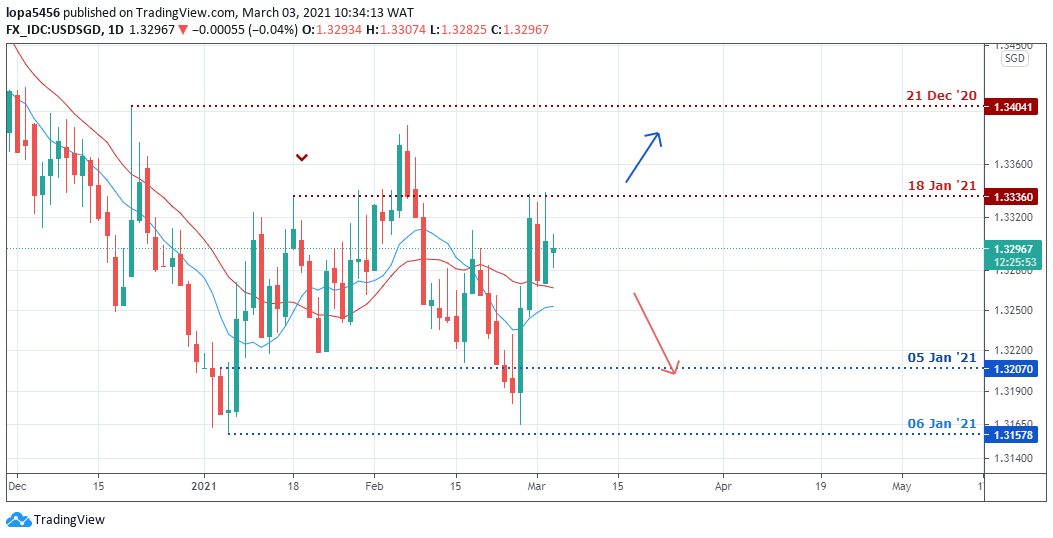
Daily Resistance Levels: 1.37130, 1.34041, 1.33360, 1.35116
Daily Support Levels: 1.32070, 1.31578, 1.32349,
The daily chart price action shows a formation of the double bottom chart pattern. We need to see the neckline’s price breakout above the 1.33360 levels for confirmed price action. If the price closes above the resistance level, we expect the price to reach 1.34041 in the coming days.
However, the neckline proves to be too strong for the buyers; we may see rejections on our daily candles, which will push back the price to the support levels of 1.37130.
Bullish Scenario:
The Bullish trend has not been confirmed since the pair’s price is still consolidating within the range of 1.33360 and 1.31578, looking at the daily time frame. However, a possible bullish scenario can occur daily should the bullish momentum closes above the 1.33360 resistance levels.
Bearish Scenario:
The bearish momentum is not over despite the slow movement and consolidating happenings on the weekly chart. The Bears would have to close below the 1.31573 level to continue their trend.
Conclusion
We can see that the outcome of the result shows that the USA flash data on the manufacturing aspect indicates growth as they show resilience to the covid-191 containment. With this result, we may see it influence another part of the economy in the coming months.

- EURUSDWeekly outlook – 7th January 2022 - January 7, 2022
- BTCUSD – Weekly outlook for Bitcoin Price – 23rd December 2021 - December 24, 2021
- USDSGDWeekly outlook for Singapore Dollar – 17th Dec 2021 - December 17, 2021
Tagged with: usdsgd


