USDSGD Technical Analysis for Singapore
Contents
Introduction
Bearish momentum persists on the USDSGD following a decline in confidence for the reserve currency (USD) across the best Singapore brokers service providers.
A correction in the strength of Asian stocks was observed on Wednesday as investors took profit off the table.
Read on for more news and highlights on technical chart patterns and levels driving the USDSGD exchange rate.
Singapore Fundamentals
Singapore bank lending is the significant fundamental indicator released this week at a lower value of 675.6B, less than the previous value at 677.5B, showing bearish sentiment for the SGD.
The readings for bank lending in Singapore started declining on April 30, 2020, at 692.4B and continues towards the close of 2020.
The charts of the Singapore30 (SG30SGD) shows a likely price slump as it trades around the MA10 and MA20 monthly time frame.
There are also traces of a hidden bearish divergence on the same MN-time frame supporting the bearish narrative.
Singapore’s 20 years bond starts a slowing after setting a new all-time high of 122.101 on May 01, 2020. The upward trend still shows a chance of continuation considering a build-up of hidden bullish divergence on the monthly time frame.
US Fundamentals
Analysts at Schroders confirmed that a quick increase in commodity prices and the US money supply brew up fears of coming inflation.
The US Chicago PMI shows the state of the manufacturing sector in the Chicago area. The actual reading was at 59.5, a positive value higher than the previous at 58.2 and forecast at 57.0.
The released reading is good for the USD as it was greater than 50 and higher than the previous and forecast.
The higher readings that now show slowing signs started from reading at 36.6 on June 30, 2020.
USDSGD Technical Analysis
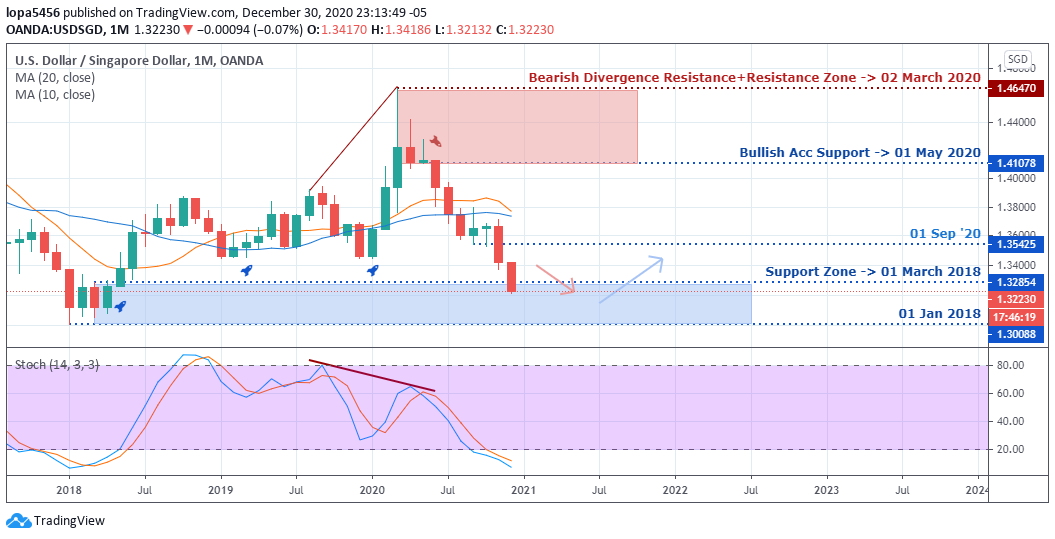
Long term Monthly Outlook: Bearish
The USDSGD exchange rate sinks into the oversold area after a breakdown of the September ’20 (1.35425) support.
We notice an increase in demand for the Singapore Dollar since the regular bearish divergence after the March ’20 high.
Weekly
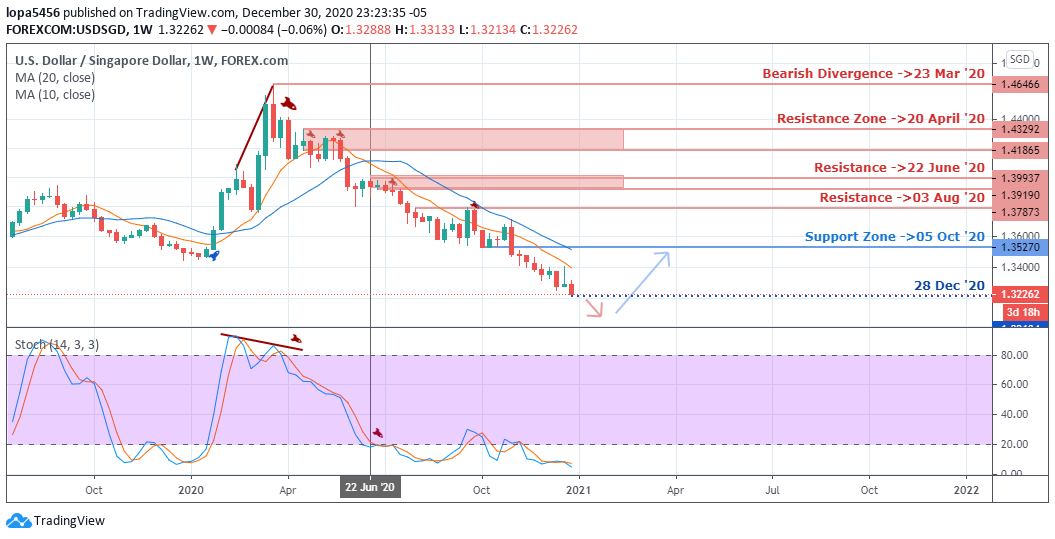
Weekly Resistance Levels: 1.35270, 1.37873
Weekly Support Levels: 1.32134
The March 23 ’20 bearish divergence pushed the USDSGD into the oversold area on January 22 ’20 and slowly moves into a bearish trend.
The bears scaled into the downslope after the exchange rate entered the MA10 and MA20 on September 21 and October 26, ’20.
The US Covid-19 stimulus fund’s release further weakens the Greenback and gives strength to the Singapore dollar and confidence of recovery in global economies.
Daily Outlook: Bearish
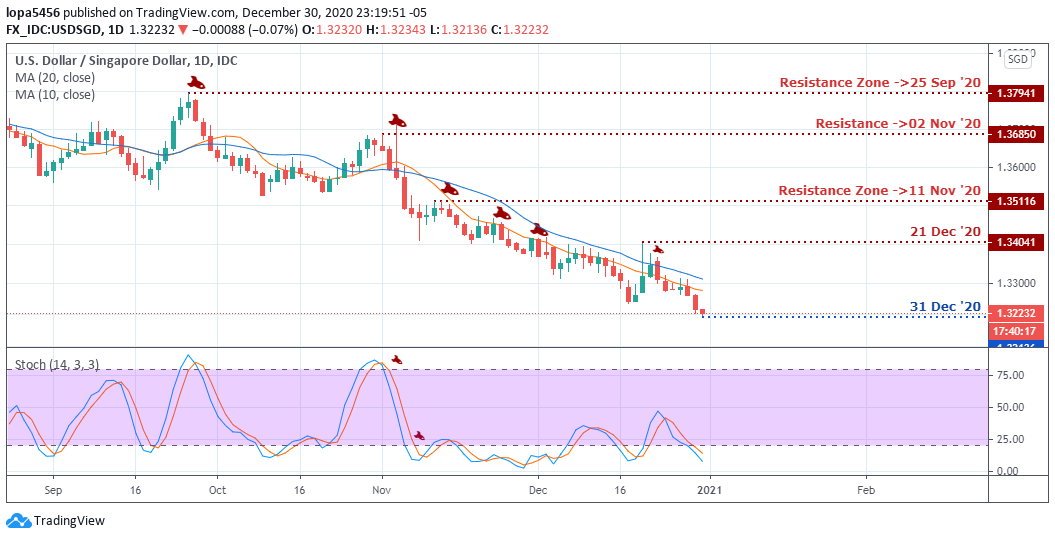
Daily Resistance Levels: 1.34041, 1.35116
Daily Support Levels: 1.32136
The daily-TF maintains a stable bearish outlook, setting lower peaks on September 25, November 02, November 11, and December 21.
The USD entered a bearish state after the stochastic %K and %D entered the oversold on November 09 ’20.
Bullish Scenario:
There has to be an exit of the oversold zone on the monthly time frame to be confident of a price rally to the upside.
Also, a price close out of the 1.32854 support zone would validate a potential upbeat swing.
Bearish Scenario:
The three analyzed time frames show the USDSGD in a definite bearish trend with no bullish recovery in view, considering the exchange rate trades below the level-50 on the monthly, weekly, and daily time frames.
Conclusion
We’ll recommend that bears lock in some profit as the USDSGD foreign exchange trades in the oversold area and within the support zone of 1.32854 and 1.30088.
- EURUSDWeekly outlook – 7th January 2022 - January 7, 2022
- BTCUSD – Weekly outlook for Bitcoin Price – 23rd December 2021 - December 24, 2021
- USDSGDWeekly outlook for Singapore Dollar – 17th Dec 2021 - December 17, 2021
Tagged with: usdsgd


