USD/SGD Technical Analysis for Singapore
Contents
Introduction
IQ Option investors must have seen the SGD gained against the USD for the past months and how Singapore’s foreign exchange was stable and robust. The upcoming presidential election also interests the USD/SGD investors, Instructional traders, and Singapore brokers because they need to know where the seat of power is going.
Singapore Fundamentals
Singapore’s manufacturing
Singapore’s economy has been recovering steadily after they eased the lockdown measures due to the COVID-19 pandemic. The manufacturing production levels had a profitable growth by 13.7% from the August report, which is the most substantial surge since the peak of the epidemic.
Other areas of improvement, like the output of precision engineering, increased from 9.4% to 9.9%, among others.
U.S. Fundamentals
U.S. CB Consumer confidence:
It bases consumer confidence on the reports gotten from the number of households relating to the country’s current economic conditions, information on labor, businesses, and others. The survey was carried out among 2500 households or over for assessments of the overall financial situation.
A report over the forecast is good for the economy, and the U.S. dollar will be bullish should the information go below the estimates, it is bearish for the U.S. currency.
Forecast 90.0 Previous 84.8
USDSGD Technical Analysis
USDSGD Long term Outlook: Bullish
Monthly Chart
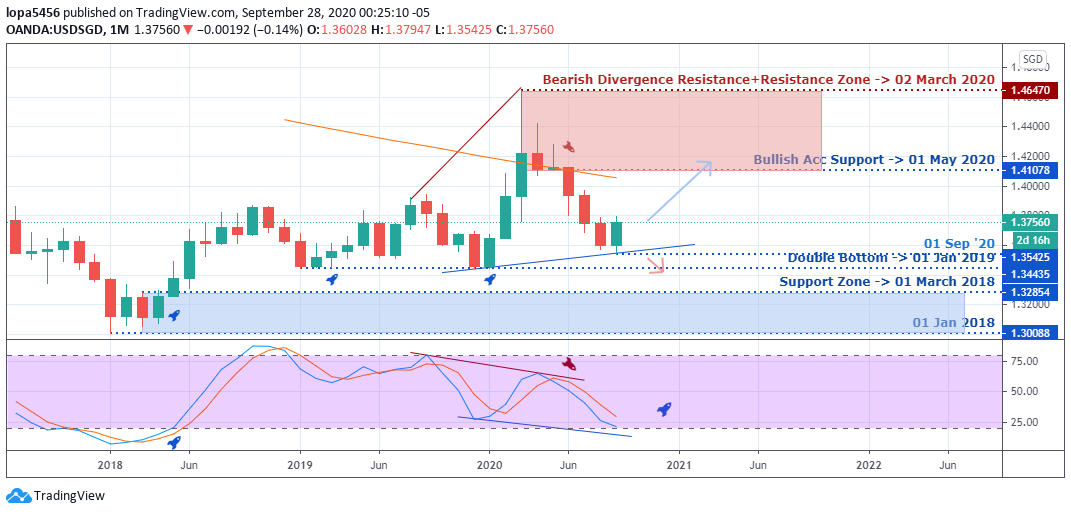
Monthly Resistance: 1.46470
Monthly Support: 1.41078, 1.35425, 1.34435, 1.32854
The USD/SGD pair have been on a downward trend for some months before finding support at 1.35425 levels, which has attracted the bulls into the market. Looking at the indicator, we can see that it is in the oversold region, and as it rises, we expect the USDSGD pair to increase.
As of September ends, the candle is forming a rail track, and we expect the Bulls to rally high to 1.41078 resistance level in the coming month. If they cannot go beyond the resistance level, we may see another push by the Bears from the resistance zone.
Weekly Chart
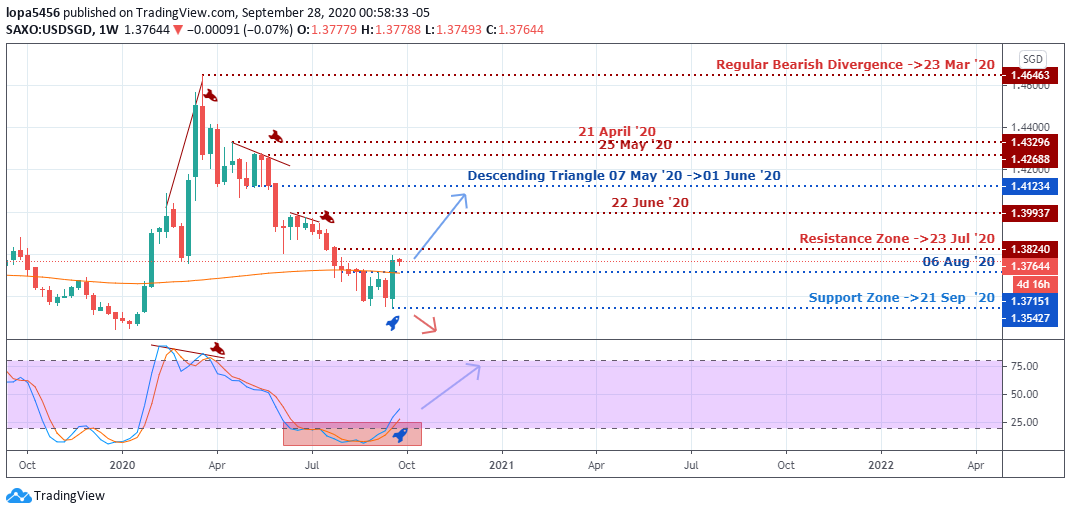
Weekly Resistance Levels: 1.38240, 1.42688, 1.43296, 1.46463, 1.37000
Weekly Support Levels: 1.35259, 1.3445, 1.38040, 1.39350
The weekly chart shows a bullish momentum candle that closed above the 1.37000 level and is supported by the stochastic indicator at the oversold zone, showing a bullish run to the 1.41234 level.
If the momentum is weak, we may see the price’s rejections at the 1.38240 levels for a bearish push to the low of 1.37151.
USDSGD Medium Term Outlook: Bullish
Daily Chart
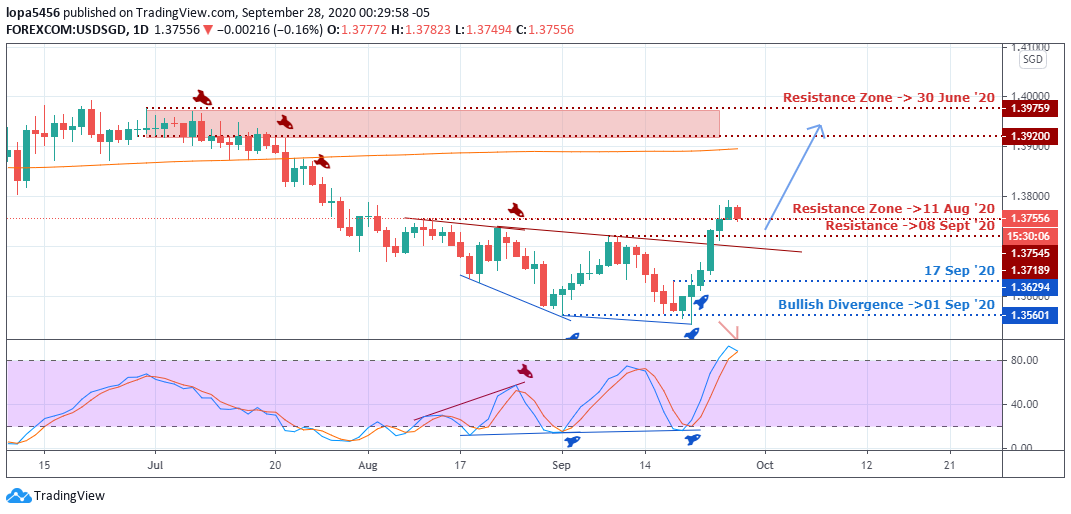
Daily Resistance Levels: 1.39759, 1.3920, 1.37545
Daily Support Levels: 1.35601, 1.36294, 1.37189
The Singapore brokers can see how the daily chart reacted to the double bottom price action that leads to the bullish breakout above the 1.37556 resistance zone. For this bullish trend to continue, the price needs to retest the breakout zone to act as a support to push the pair higher towards 1.39759.
If the bearish move should go below 1.37545 levels, we may see it testing the 1.36294 levels below, which signifies the continuation of a downtrend.
USDSGD H4 Chart
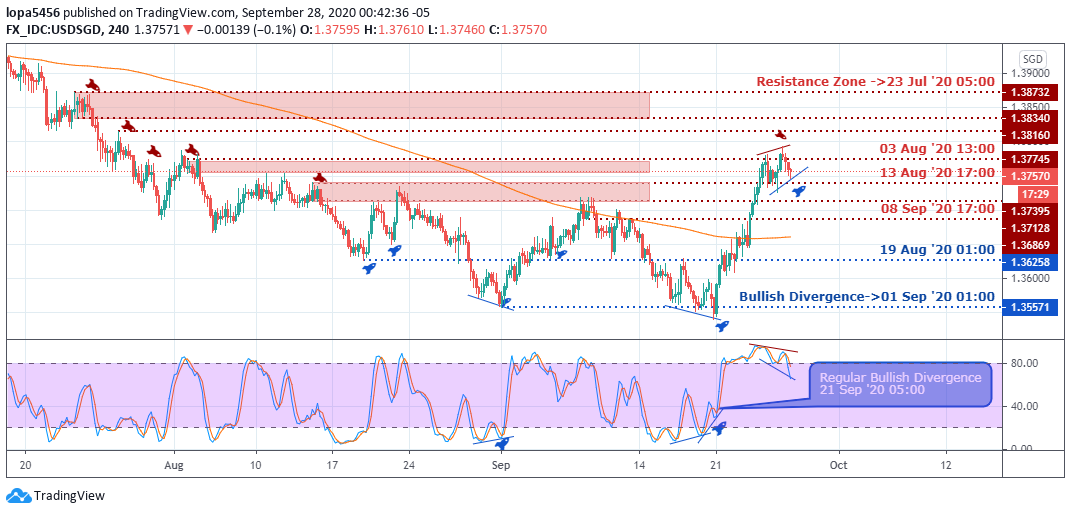
4Hour Resistance Levels: 1.38732, 1.38340, 1.38160, 1.3775
4Hour Support Levels: 1.35571, 1.36258, 1.36869, 1.37395
The four hours’ time frame showed that the bullish trend played out having a bullish divergence setup at the support zone of 1.35571; at press time, the trend is about to pull back for support, having respected the resistance levels of 1.3774 and 1.37570.
As the USD/SGD pair retraces, then bears may want to push the price down to the 1.36258 zones, or the moving average may serve as a dynamic support for the price.
Bullish Scenario:
A general bullish scenario is still at play from the four hour and daily time frames, and the momentum will likely take the price to the high of 1.39759 as events unfold.
Bearish Scenario:
A short term bearish scenario can be seen on the four-hour time frame as we look for a retracement of the uptrend from the 1.3775
Conclusion
The USD/SGD pair has been favorable to the Singapore’s foreign exchange as the pair has been a bearish trend amid COVID-19 as a result of U.S. currency that was weak across all pairs due to the challenges the country faced.
However, there are indications that the U.S. currency is about regaining its strength across all pairs in the coming months.
However, if the bull’s momentum is weak on the four-hour timeframe, we may see the bears push the price down to 1.36258.

- EURUSDWeekly outlook – 7th January 2022 - January 7, 2022
- BTCUSD – Weekly outlook for Bitcoin Price – 23rd December 2021 - December 24, 2021
- USDSGDWeekly outlook for Singapore Dollar – 17th Dec 2021 - December 17, 2021
Tagged with: singapore dollar • usdsgd


