USDSGD Technical Analysis for Singapore
Contents
Introduction
The Singapore dollar continues to see more wins against the USD for nine months in a row now. However, we notice a slowing of the price decline as the foreign exchange trades within the January and March ’18 support zone on the top online brokers in Singapore.
We cover more fundamental and technical chart patterns driving the USDSGD exchange rate in this article; read on.
Singapore Fundamentals
This week’s release of the Singapore non-oil export came out positive at 6.80%, a value that’s way greater than the previous at -5.0%.
The data comes out positive after a series of four gloomy months, which started on July 17, ’20.
As a measure of value in imported and exported services and goods, the Trade balance shows a more significant export of services and goods than imports.
The readings for this week came out positive at 6.200B against a previous 3.930B.
US Fundamentals
Janet Yellen, US Treasury Secretary nominees’ speech, led to a hike in Asian stocks to new highs after pushing for a massive fiscal relief to help the US economy sail through the COVID-19 pandemic.
Yellen stated that the benefits of a vast stimulus package greatly outweighs the burden of higher debt.
Investors earnestly wait to actualize the proposed 1.9 trillion USD stimulus package by President Joe Biden and already stacking up positions on high-risk assets.
According to Yoshinori Shigemi of Fidelity International, we should expect large-scale fiscal spending as the Fed looks to achieve full employment and 2% inflation, consequently dropping inflation.
The HSI Hong Kong Han Seng increase by 1.0%, leaning towards 2019 high, while the Asia-Pacific Index MSCI outside Japan climbed by 0.81%, setting a new ATH-All time high.
The NQ1 US Nasdaq futures gained 0.5%, while Netflix NFLX jumped by 12.2%.
Expectations on a positive Joe Biden proposal resulted in a rise in oil prices with US crude oil futures hitting 0.3%, and Brent BRN1! Crude oil futures also attained a 0.3% gain.
USDSGD Technical Analysis
USDSGD Long term Monthly Outlook: Bearish
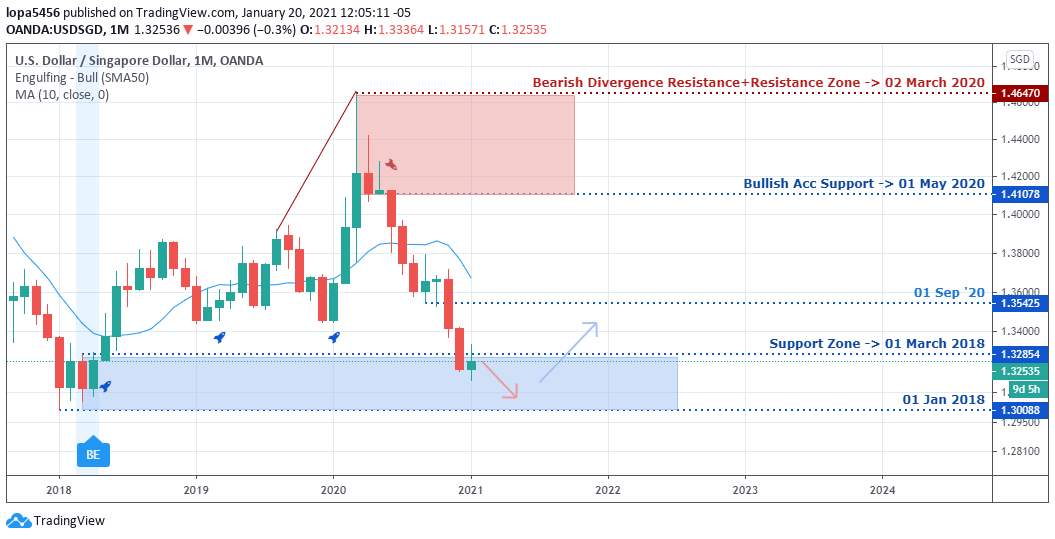
Following a crackdown on the 1.41078 support and bearish divergence structure, the USDSGD extended way below the MA10, lower into the 1.32854 and 1.30088 support zone.
USDSGD: Weekly
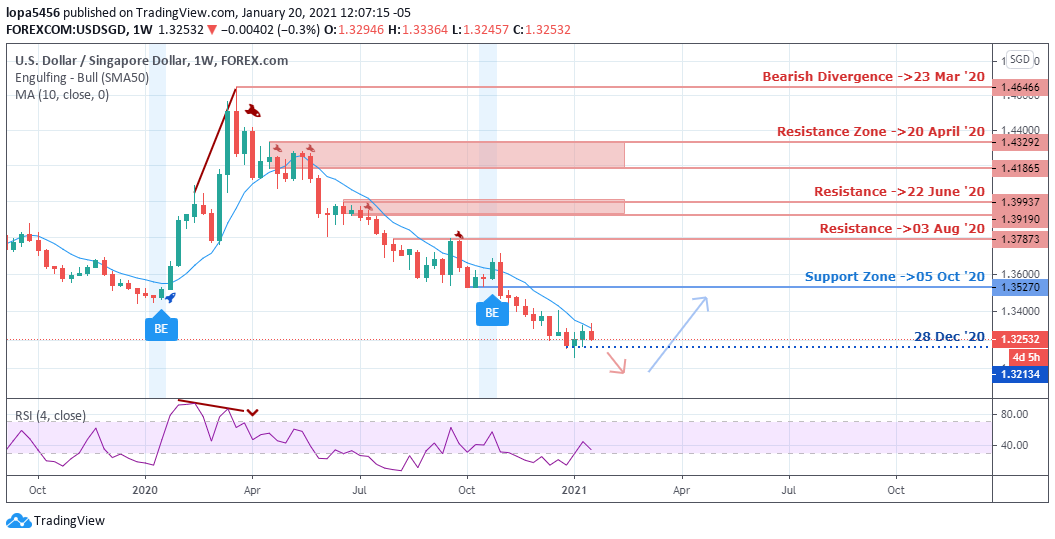
Weekly Resistance Levels: 1.33251, 1.35270
Weekly Support Levels: 1.32134
The selling pressure on the USDSGD intensifies, as revealed on the weekly chart above. All attempt to restore strength in the Greenback is quashed as USDSGD trade within the MA10 now serving as resistance.
The bearish trend gets more assertive with the Relative Strength Index trading below the level-70.
The proposed President Joe Biden stimulus package brings negative sentiments to the dollar as investors lose confidence in the Greenback.
USDSGD Daily Outlook: Bearish
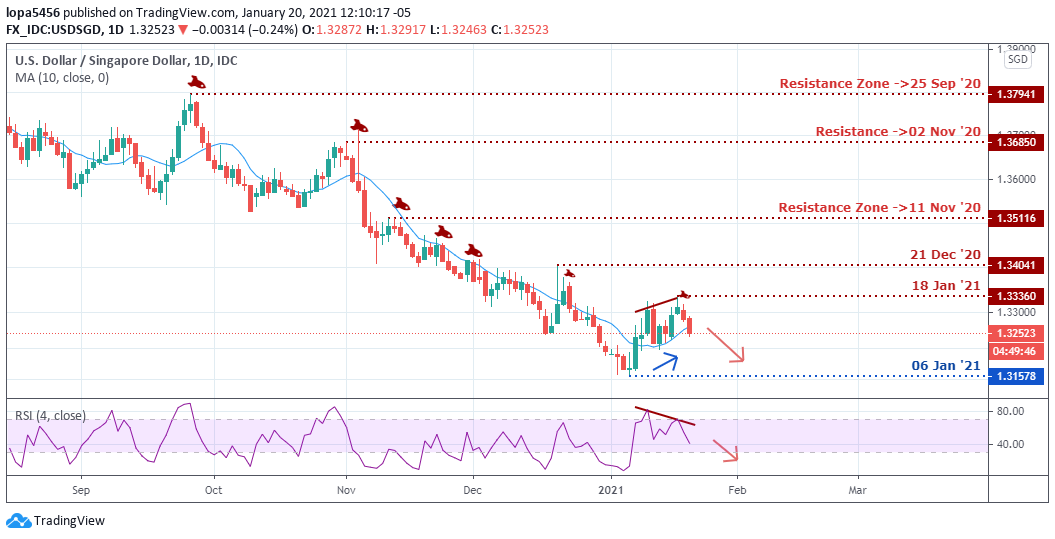
Daily Resistance Levels: 1.33360, 1.34041
Daily Support Levels: 1.31578
The daily-TF is clearly in a bearish trend, as the exchange rates establish lower highs and lower lows.
On January 18, ’21, a recent bearish divergence is enough to send the exchange south towards the 1.31578 support.
Bullish Scenario:
Right now, the USDSGD shows a healthy bearish outlook. However, an exit of the March ’18 monthly candlestick high will hint at a comeback for the bulls.
Bearish Scenario:
As revealed in all the analyzed time frames, the USDSGD shows a healthy bearish outlook. However, timing is critical to optimize the downward trend.
The current bearish divergence on the daily time frame is an excellent signal to short the USDSD in the short to mid-term.
Conclusion
At the current state of the USDSGD exchange rate, it is advised that sellers should consider fixing some of their gains, as threats of a mutating Coronavirus increases market uncertainties.

- EURUSDWeekly outlook – 7th January 2022 - January 7, 2022
- BTCUSD – Weekly outlook for Bitcoin Price – 23rd December 2021 - December 24, 2021
- USDSGDWeekly outlook for Singapore Dollar – 17th Dec 2021 - December 17, 2021
Tagged with: usdsgd


