USDSGD Outlook – 17th June 2021
Contents
Introduction
The restrictions that were newly imposed should be of concern to online brokers such as IQ Option. The Singapore stocks had their worst session in nearly a year because of the announcement on restrictions, also the USDSGD pair fell about 0.2%.
However, the Asian stocks were strengthened on reassurances from the U. S FED that the spike in inflation was temporary.
Singapore Fundamentals
At the close of last week’s trading activity, the Singapore stocks tumbled down about 3% loss when the city-state’s imposed stricter COVID-19 curbs because of the worries about a potential outbreak of the virus. There are stricter restrictions on social gatherings and the public amid an increased infection that is locally generated.
Before now, the Asian trades and financial hub have been reporting single digit on the infection rates locally for months before a recent rise. The action had caused the Singapore Airlines C6L flag carrier to slump to about 7% a loss and about 4% drop in SATS Ltd S58 in-flight caterer.
Furthermore, the Core consumer prices for Singapore increased by 0.60% as of April’s report 2021 which is higher than the previous year’s outcome of April 2020 while USDSGD was strengthened by 0.1%.
US Fundamentals
Core Retail Sales m/m
The Change in the total value of sales at the retail level usually excludes automobiles because they tend to be volatile and can distort the underlining trend. However, automobile sales account for about 20% of retail sales.
The core data is a better gauge of spending trends which is released monthly about 16 days into the new month.
If the retail sales data should come out higher than the forecast, it is good for the US currency, but a lower data will not be significant to the US dollar and the USDSGD may turn bearish.
The previous data was -0.8% while the forecast is 0.4%.
USDSGD Technical Analysis
USDSGD Long term Price Analysis
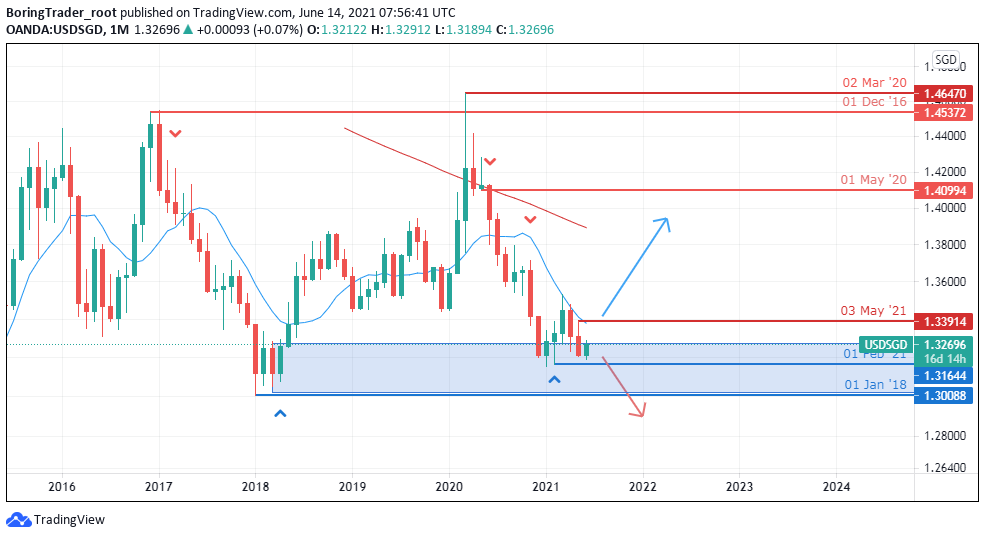
Monthly Outlook: Down Swing Slowing within Significant Support Area
Monthly Resistance 1.40995, 1.45372
Monthly Supports 1.30088, 1.31644
The USDSGD pair is sitting on a support zone that previously shut the Bulls up as of January 2018. The zone is a significant area for both buyers and sellers in the market. Psychologically, the Bulls wish to push the price up from the zone towards the resistance level of 1.40995 if they have the momentum to overturn the Bears pressure.
However, the Bears are hoping to close below the significant support zone of 1.30088 to have total dominance of the market if they can overturn the support level into a resistance. Hints about the Feds plan concerning the plans to taper its bond-buying program as the U.S economy bounces back from the COVID19 pandemic fallout is what Singapore brokers and other traders are interested in.
Weekly
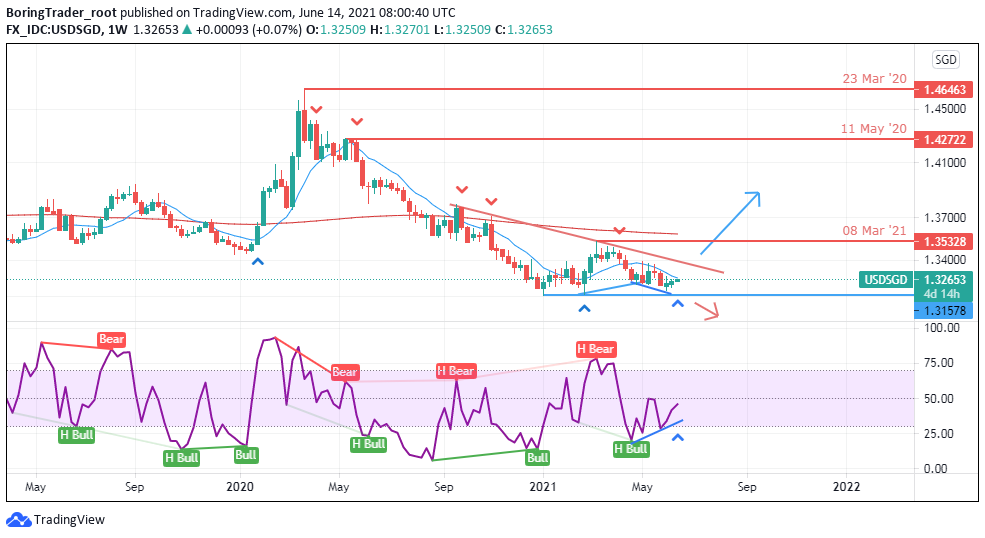
Weekly Resistance Levels: 1.35328, 1.3700, 1.4100, 1.42722
Weekly Support Levels: 1.31578
For the past weeks, since the COVID19 pandemic ravaged the global economy, we can see that the US dollar has lost its strength against the emerging currencies as their economy continues to recover from the effect of the virus.
You can see that the pair has been consolidating within a range of resistance (1.35328) and support of 1.31578 for some weeks.
This accumulation is an indication of a possible breakout of price either to the downside or to the upside. If the bearish trend can break below the 1.31578 levels, we shall see the USD vs. SGD continue the Bearish trend. Looking at the chart pattern on the weekly timeframe we can see a possible double or triple bottom pattern that is forming around the support level for a bullish run if the momentum is stronger than the Bears pressure.
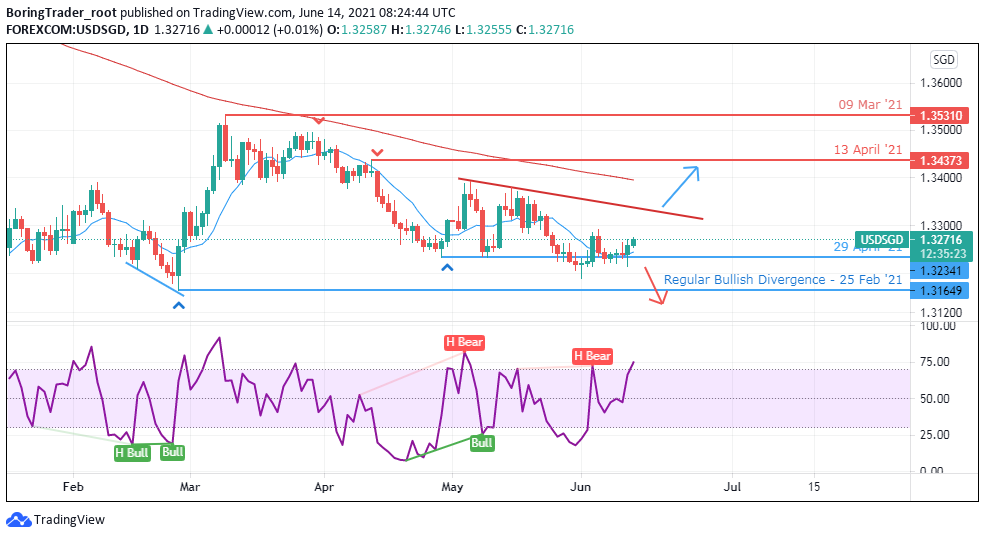
Daily Outlook: Bearish
Daily Resistance Levels: 1.3300, 1.3400, 1.34373
Daily Support Levels: 1.31650, 1.32340
The Singapore brokers are losing the steam on the daily chart as we see the long position traders rejecting the bear’s advancements with strong bullish candles anytime the price of USDSGD comes down towards the support levels.
If the bulls can break above the daily resistance trend line from the highs, we shall see the price of the USDSGD pair reaching the resistance levels of 1.34373.
On the other hand, if the Bulls fail to close above the trend line, we may see the bears closing below the support zones of 1.32340 and 1.31650 for another bearish swing.
Bullish Scenario:
A bullish scenario is possible this trading week if the US fundamentals favour the currency in line with the technical analysis on the daily time frame. We expect the Bulls to dominate the market in this trading week.
Bearish Scenario:
The Bears had been in control of the market since the Covid-19 crisis, the incident had favoured the Singapore dollar against the US dollar since the pandemic got to its peak.
As the recovery plan continues in a different part of the world, we may begin to see the US dollar getting stronger.
However, we need to see the bears close below the 1.31650 for the market to keep going south.
Conclusion
The USDSGD pair may be experiencing an upward movement at the beginning of the trading week since some members of the FOMC are hawkish in their decisions towards the Taper talk.
Some analysts say that it won’t have a huge impact on the emerging forex markets like it did in 2013 as the Federal Reserve’s members are very careful with their approach to the issue.
The outcome of some certain news from the U.S economic calendar will drive the market with high volatility.

- EURUSDWeekly outlook – 7th January 2022 - January 7, 2022
- BTCUSD – Weekly outlook for Bitcoin Price – 23rd December 2021 - December 24, 2021
- USDSGDWeekly outlook for Singapore Dollar – 17th Dec 2021 - December 17, 2021
Tagged with: usdsgd


