USDSGD Technical Analysis for Singapore
Contents
Introduction
The binary options brokers are paying attention to the U.S. inflation data for March with anticipation for a rise, while in terms of retail sales, a double-digit gain is recorded with gains for the U.S. sales.
Report from the Singapore manufacturing sector shows continuous improvement with a faster rate of expansion by 0.3 points at a growth of 50.8 compared to that of February, according to SIPMM.
Singapore Fundamentals
The retail sales in Singapore rose to 5.2% during the February data released, and the increase was spiked because of the Chinese New Year Festival demands after its downtrend in sales. The sales increase in watches, jewelry, clothes, and shoes grew by over 31.7%.
The sales record also increased in recreational goods by 13.9%, telecom gear, and computers by 12.9%, while household items increased by 11.5%.
During the covid-19 peak period, supermarkets and hypermarkets were key benefactors saw a rise in the sale over 13.5% while convenient stores and mini-marts saw an increase of 1% which was a boost for the Singapore foreign exchange.
U.S. Fundamentals
The Unemployment Claims
The Department of Labor releases the U.S. unemployment claims based on the numbers of individuals who filled in for insurance for the first time in that week. The data is a significant factor in the aspect of monetary policies for those steering the policies.
An actual result lower than forecast is good for the currency, while an outcome higher than the forecast is not suitable for the U.S currency. The forecast is 703K while the previous data release was 744K.
The robust U.S. economic data shows a divergence between fast U.S. economic recovery and the stunted recovery in the other developed economy as we the dollar make gains against other currencies in recent times.
USDSGD Technical Analysis
USDSGD Long term Price Analysis
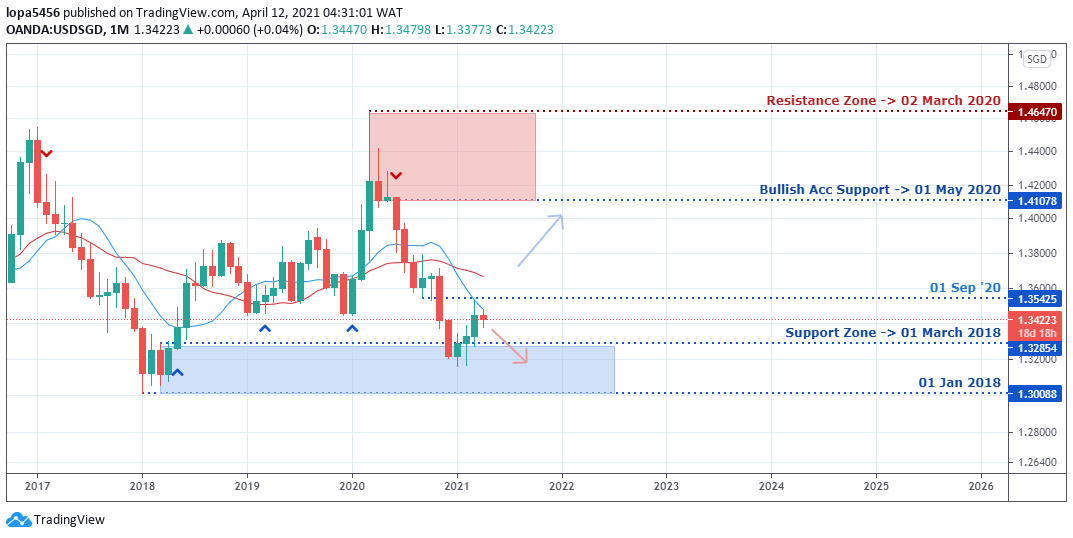
Monthly Outlook: Bearish Slowing within Significant Support Zone
Monthly resistance levels 1.37947, 1.35308
Monthly support levels 1.30088, 1.31571, 1.31644
The Singaporeans foreign exchange has entered into a support zone where it will weaken its bearish momentum because of the previous support level of January 2018.
There is a possibility that we will see the Bulls rally from the zone in the coming months as the indicator shows the price in an oversold region to support the bullish move. If the bullish run can close above the 1.35425 level, we shall see the pair rally to the 1.41078 resistance zones.
However, if the price cannot close above the 1.35425 zones, we may see it drop back to close below the 1.30088 zones for a continuation of a bearish trend.
Weekly
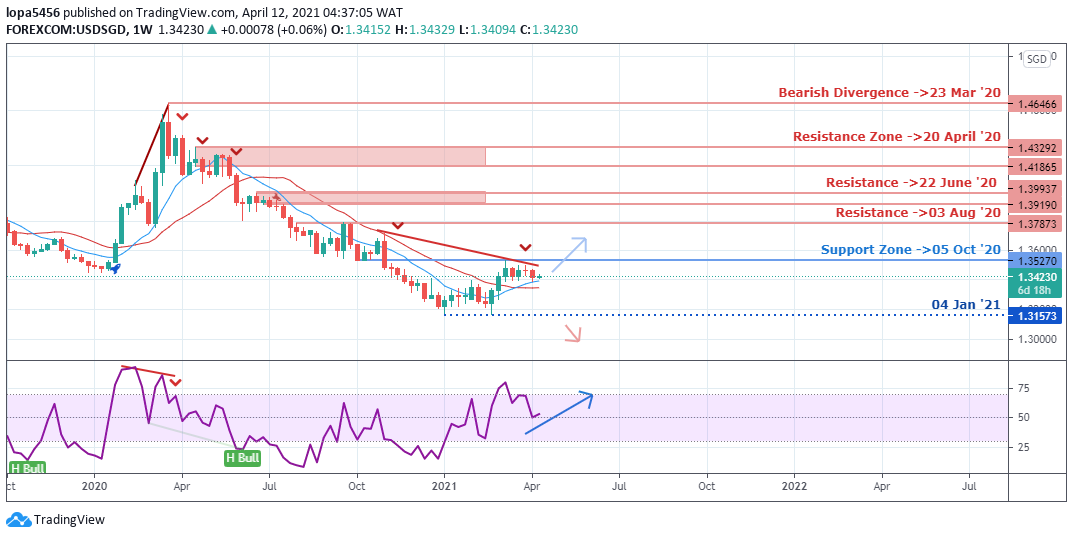
Weekly Resistance Levels: 1.35310, 1.37136
Weekly Support Levels: 1.31573, 1.31649
The USDSGD pair has been on a bearish trend since the covid-19 crisis got to its peak as of last year, March 2020. The Bulls tested the 1.35270 zones intending to close above it, but its momentum has been weak to breakout above the zone. The past weeks showed low market activities as neither the bears nor the bulls could decide the market’s direction.
For this week’s analysis, we are likely to see the pair move in a bearish trend as we expect the price to fall from the 1.36000 levels. We anticipate that the bears will reject the over-bought zone’s price conforming with the stochastic indicator for a sell position trade.
We expect the price to retest the low of January 04, 2021, for a breakdown of the support level, or we get a double bottom chart pattern for another bullish surge if the support level should hold.
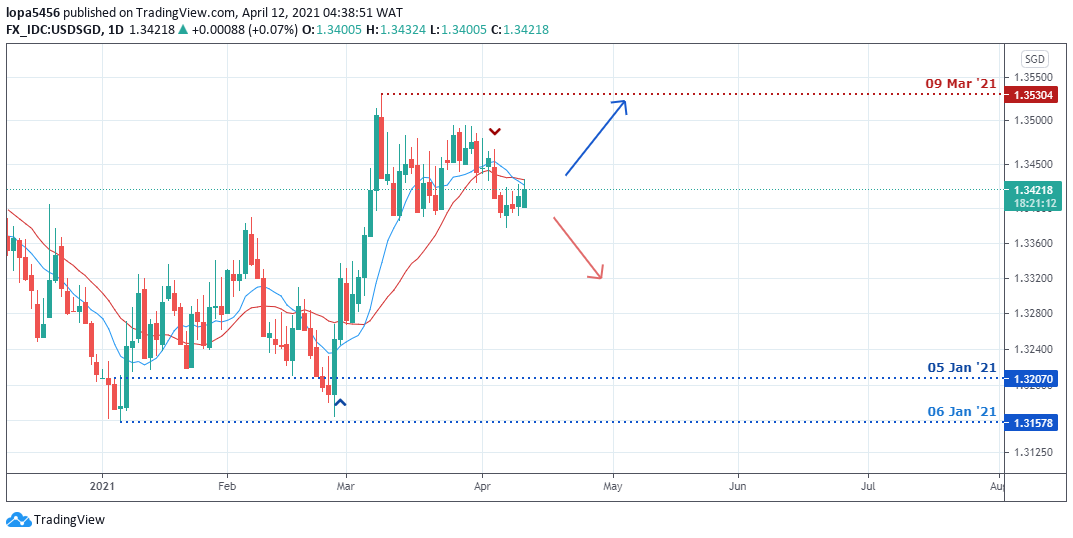
Daily Outlook: Bearish
Daily Resistance Levels: 1.35304, 1.3494, 1.34796, 1.3437
Daily Support Levels: 1.31578, 1.31648
We can see that the bears are dominating the zone with more giant candles during this report’s writing, and a close below the 1.34041 level will push the pair down further. If the downtrend momentum is strong, we may see the price breaking the 1.33361 support and reaching the 1.32070 levels.
However, the support zone has been holding for days without any bearish close below. If the bull’s momentum is strong, we may see them dominates the area for a bullish rally towards the 1.35306 zones in the days to come.
Bullish Scenario:
A bullish scenario is possible on the monthly time frame, but it will take a while before it peaks up. The support zone on the daily chart (1.31578 and 1.32070) of January 2021 is an area where the bullish momentum is most vital.
Bearish Scenario:
Presently, the USDSGD pair is on a bearish trend on the daily chart, and the weekly time frame is supported by an indicator showing the loss of bullish run on the stochastic chart as the price has entered the overbought zones.
Conclusion
The Chinese authorities fined Alibaba Group Holding Ltd BABA with 18 billion yuan ($2.76 billion). They will feel the decision across China as most of the investors are from the U.S., making up over one-third of all the stock and more than 8% of the MSCI EM index. This fine will affect the various markets like stocks, bonds, and currencies also.
We may see the pair go bearish during the early periods of the week before a bullish surge pushes it up.

- EURUSDWeekly outlook – 7th January 2022 - January 7, 2022
- BTCUSD – Weekly outlook for Bitcoin Price – 23rd December 2021 - December 24, 2021
- USDSGDWeekly outlook for Singapore Dollar – 17th Dec 2021 - December 17, 2021
Tagged with: usdsgd


