USD/SGD Technical Analysis for Singapore binary options
Contents
Introduction
The pair, USDSGD has been in a downward slope for a period of fifteen weeks now, showing a strong Singapore dollar. However, moving forward the USD is starting to dissolve this move as a mere major bullish trend retracement. Join us this week as we take a look at the fundamental and technical patterns deciding the switch in polarity.
Singapore 30 [SG30SGD]
The Singapore30 after a sudden price jolt by a bullish accumulation on December 31 ’18 is currently facing resistance from a bearish accumulation pattern on January 28 ’19. A bullish accumulation pattern is also in view, which could possibly lead to further price gains, before the final anticipated price slump.
U.S Core CPI

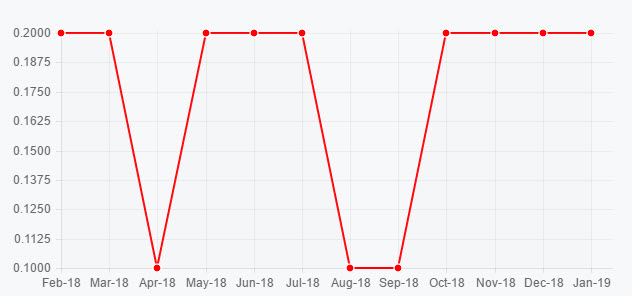
Excluding the price volatility of energy and food, this is the core index of inflation which is targeted by the central bank within a three to six month period. The actual release came out 2.2 which is higher than the consensus which was at 2.1 and the same as the previous. This is an indication of the steady growth of the U.S dollar.
Technical
USDSGD: Monthly Chart

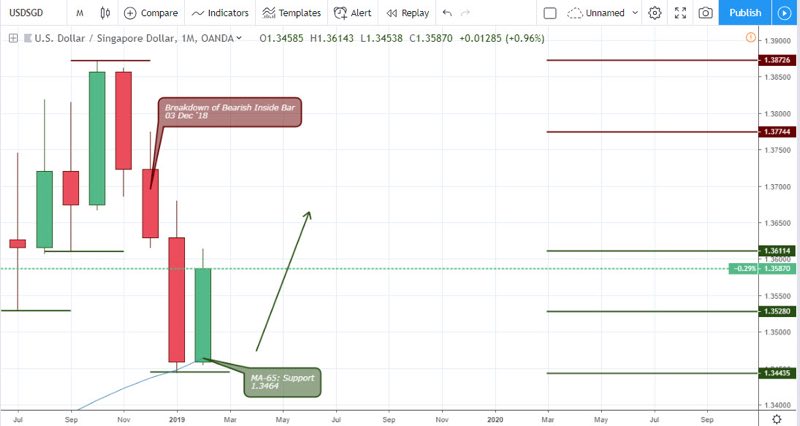
On the above monthly chart, the MA-65 serves as a support for the USDSGD causing the price to recoil by 1.13%. This recoil was after the sudden increase in volatility initiated by a breakdown of a breakdown of a bearish inside bar on December 03 ’18.
USDSGD: Weekly Chart

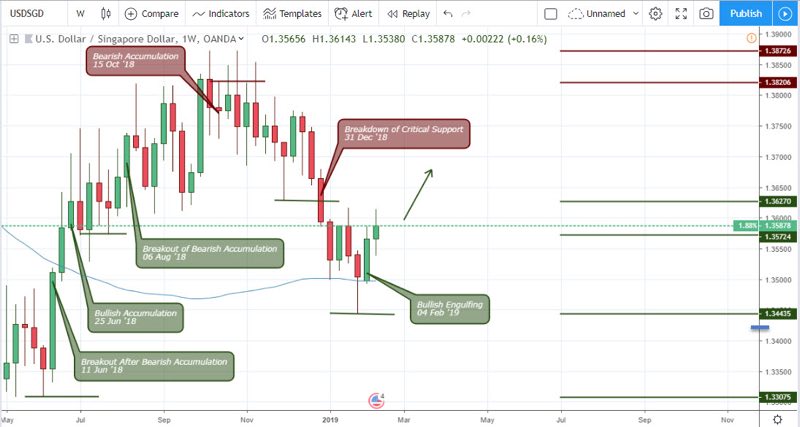
A bearish accumulation pattern triggered on October 15, ’18 initiated a retracement of the bullish trend that started from the bullish engulfing pattern in combination with a bearish accumulation pattern on June 11 ’18. The bullish trend made a 2.65% ascent while the bearish retracement made a 2.37% descent and currently sits on the MA-65 similar to the monthly time frame.
USDSGD: Daily Timeframe

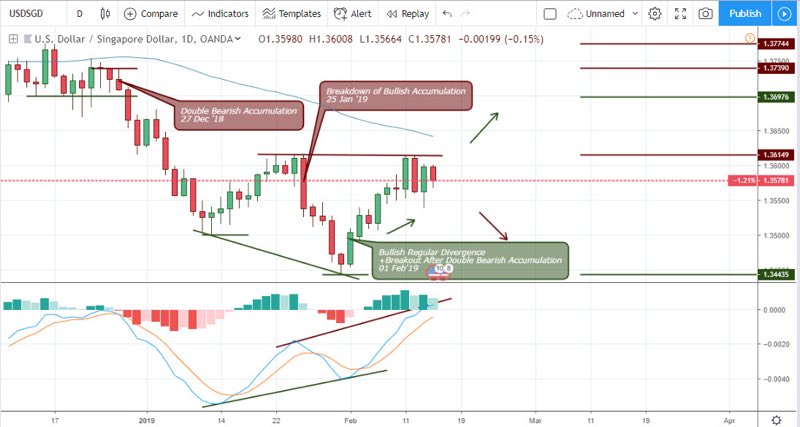
The bullish engulfing pattern on the higher weekly chart simply served as confirmation to the bullish regular divergence on February 01 ’19. The above triggered regular bullish divergence came in combination with a consecutive bullish engulfing on the same on February 02. As price approached the 65-period moving average, we start to see a slowing of the bullish rise and a possible build-up of bearish hidden divergence.
4-HR Chart of the USDSGD
From a 4hour time frame, the bullish trend began from a breakout of hidden bearish accumulation, as further bullish patterns in the form of bullish accumulation and classical breakout of bearish accumulation on January 31, February 06, February 08 and finally February 13 ’19 pushed price to trend over the moving average.
Deep bearish oscillatory swings were triggered by a bearish dark cloud cover on February 11 ’19 22:00 and recently on February 13 ’19 22:00.
2-HR Chart of the USDSGD
The 2hour chart is popularly traded on binary broker Olymp Trade as it offers shorter trade holding time and sometimes more rewards compared to risk. As shown above, the pair break out of a critical resistance level on February 08 ’19 18:00 for a 0.36% rise compared to a 0.12% risk.
Later on, we witness a collapse on the same time frame by a breakdown of hidden bullish accumulation and dark cloud cover for a 0.43% compared to a 0.13% risk. Later on the next day, the Singapore dollar could not sustain the strength from the bearish descent as a bullish engulfing pattern was triggered after a bearish accumulation to confirm a continuation of USD dominance.
Conclusion
So far, the foreign exchange of the USDSGD is gradually building up a bullish campaign as major fundamental and technical indicators are in alignment. The lower daily, 4hour, and 2hour chart may offer swing trading opportunities on the USDINR, as the SGD30 is still not clear on its trend direction. However, we favor a bullish USDINR over bearish.

- EURUSDWeekly outlook – 7th January 2022 - January 7, 2022
- BTCUSD – Weekly outlook for Bitcoin Price – 23rd December 2021 - December 24, 2021
- USDSGDWeekly outlook for Singapore Dollar – 17th Dec 2021 - December 17, 2021

