USD/SGD Outlook and Technical Analysis for Singapore binary options
Contents
Introduction
This week we’ll be looking at how the exchange rate of USD/SGD is experiencing a slow but steady rise from both technical price action and important news events.
Singapore Fundamentals
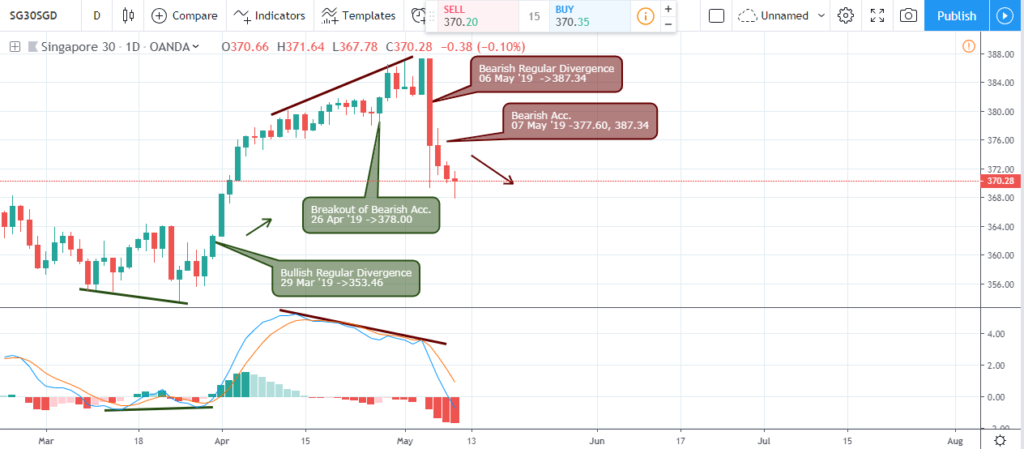
Singapore 30 (SG30SGD): Daily Chart

Following a bullish flagged bullish regular divergence on 29 Mar ’19, the Singapore 30 entered into a bullish trend which increased by 6.80% from the MACD golden cross.
On 06 May ’19, a counter bearish divergence was initialized sending the price of the SG30 into a downward spiral.
This is an indication of a weak Singapore dollar as shown on IQ Option Singapore platform at the broker section of our site.
United States Fundamentals
U.S Consumer Price Index – CPI
The Department of Labor Statistics in the United States will issue the CPI Ex Food and Energy on Friday, May 09 ’19.
This indicator measures the price movement by comparing the retail prices of a typical shopping basket of goods and services.
Products of volatile nature, such as energy and food are omitted to obtain a precise estimate.
A greater than assumed reading is normally viewed with positive sentiment for the USD, while a low result is deemed bearish.
Technical Analysis
As always, we’ll be deploying a top-down analysis starting with the monthly chart.
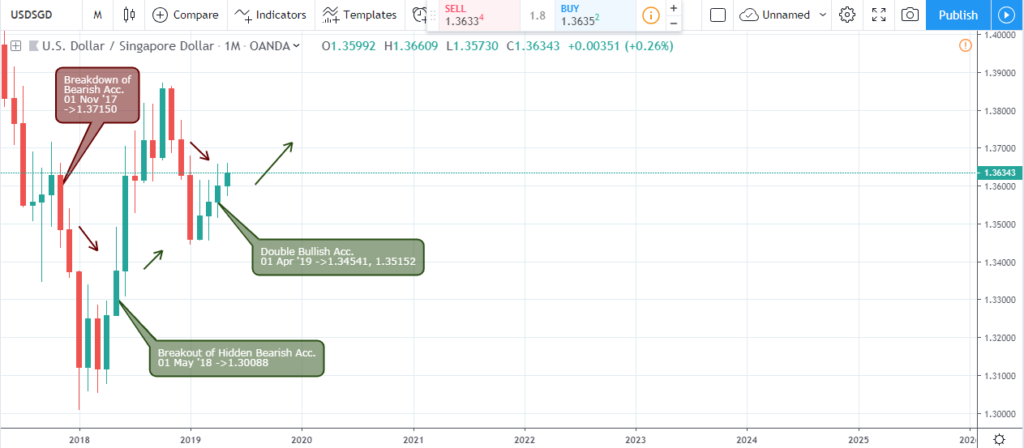
USD/SGD Monthly Chart

The Singapore economy experienced strength in its economy as it reflected in the nation’s foreign exchange. This price move observed from a signaled regular bearish divergence setup on the monthly chart (02 January ‘17), confirmed by a bearish engulfing price pattern.
Attempts by the bulls towards restoring their grip failed to a collapse of bullish accumulation support of 1.34919 on 02 October ’17.
Following a breakout of hidden bullish resistance on 01 May ’18, the USD to SGD pair soared by about 3.65% from the breakout point, to later retrace 50%(Fib retracement) of the upswing.
On the 50% Fibonacci support level, the pair signaled double bullish pressure price setup at the closing price of 01 Apr ’19, with established support levels at 1.34435, 1.34541, and 1.35152 respectively.
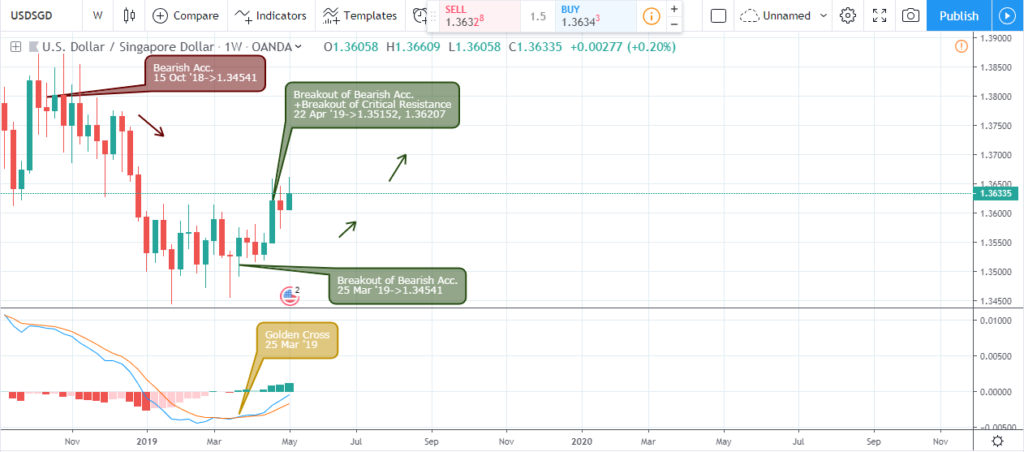
USD/SGD: Weekly Chart

Taking a step lower to the weekly time frame, the classical bearish pressure resistance signalled on 15 October ’18 is responsible for the price breakdown that continued for approximately 14 weeks.
A price breach of a similar bearish pressure resistance was eventually confirmed on 25 March ’19, setting up new support at 1.34541.
Moving another 4 weeks further, the pair again signals another break of a higher bearish pressure resistance on 22 April ’19 eventually establishing the MACD golden cross.
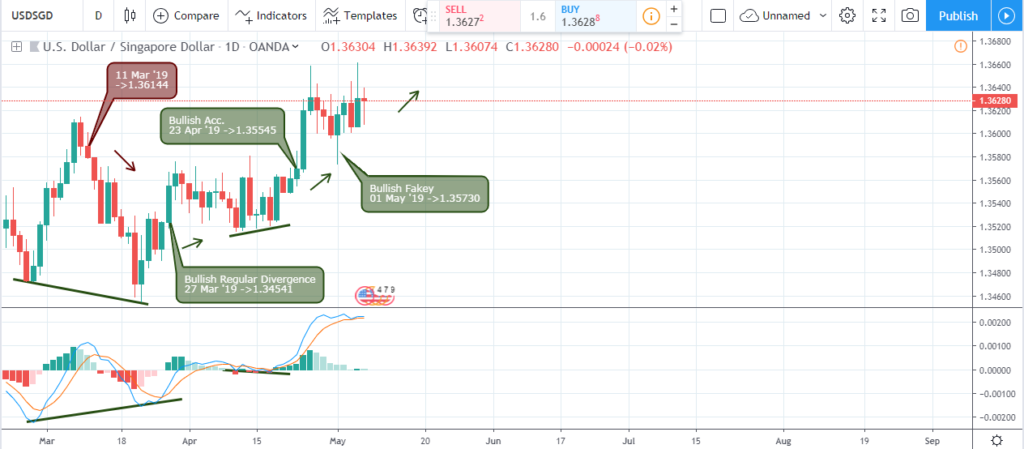
USD/SGD Daily Chart

It’s been a rollercoaster on the daily time frame as consecutive bullish and bearish candles between 27 February ’19 and 21 March ’19 transform into a bullish regular divergence setup after the golden cross of 27 March ’19.
On 18 April ’19, a bullish hidden divergence pattern was flagged confirming a continuation of the bullish trend. A bullish Accumulation setup signalled on 23 April ’19 reinforced the upward trend as the price climbed by 0.65%.
Conclusion and Projection
The USD to SGD currency pair is clearly in a bullish trend as the current bullish support levels on the monthly chart props it up. We look forward to an increase in exchange rate towards the previous 1.38726 resistance of 01 October ’18.
On the other hand, a collapse of the bullish pressure supports of 1.35152 may repeat a strengthening of the Singapore dollar similar to that of 01 November ’17.

- EURUSDWeekly outlook – 7th January 2022 - January 7, 2022
- BTCUSD – Weekly outlook for Bitcoin Price – 23rd December 2021 - December 24, 2021
- USDSGDWeekly outlook for Singapore Dollar – 17th Dec 2021 - December 17, 2021

