USDSGD Outlook and Technical Analysis for Singapore Brokers
Contents
Introduction
Last week’s bullish close shows a positive sentiment in favor of the USD against the Singdollar on major Singapore broker platforms.
Come along as we expose the technical and fundamental drivers of the foreign exchange.
Singapore Fundamentals
Singapore URA Property Index
Information on construction output and activity provided by the construction industry offers a window into understanding the supply on the home and build market. A rise in the number of fresh construction starts or the number of construction completed signals business optimism and a boost for the overall economy. On the flip side, however, an excessive supply of new buildings may result in a drop in housing prices which in turn may affect the economy negatively.
United States Fundamentals
U.S. (GDP)
The GDP gauges the yearly contrast in the adjusted inflation rate of all services and goods produced by the market. It is the primary indicator of how robust the economy is and offers the broadest evaluation of economic activity.
An Actual reading that is greater than the Forecast is positive news for the currency.
From the data latest released, Actual figure for June 27 was 3.1% while the Forecast and previous reading was 3.1%. This reading reveals a ranging sentiment for the currency.
From the data latest released, Actual figure for June 27 was 3.1% while the Forecast and previous reading was 3.1%. This reading reveals a ranging sentiment for the currency.
USDSGD Technical Analysis
USDSGD: Monthly Chart

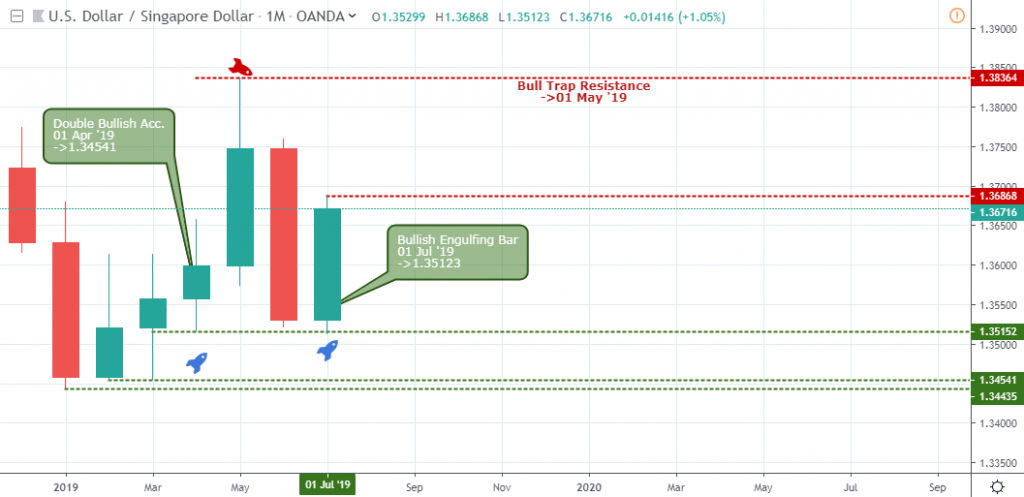
Let’s begin with a bird’s eye view from the monthly time frame. The increase in buying power on April 01 ’19 established sound support at 1.34541, and 1.35152 in sequence resulted in a sudden surge in the foreign exchange of the USDSGD up to a high of 1.38364, followed by a sharp price decline.
The previous bullish support of 1.35152 on April ’19 stopped the price decline in its tracks and served as a springboard for the current price increase.
USDSGD: Weekly Chart

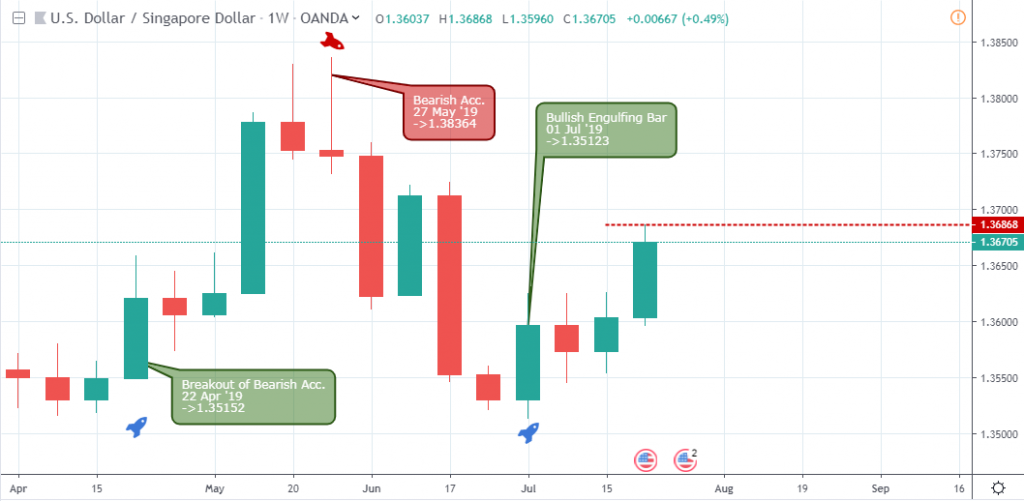
A breakout of sellers resistance on April 22 ’19 confirmed the increase in demand signaled on the monthly time frame, while an increase in selling pressure with a long upper candle wick signaled profit taking for long entry as the price plummets.
On the first day of July, a bullish engulfing candlestick pattern confirmed the strength of April support levels, and sends the price up to a high of 1.36868.
USDSGD Daily Chart

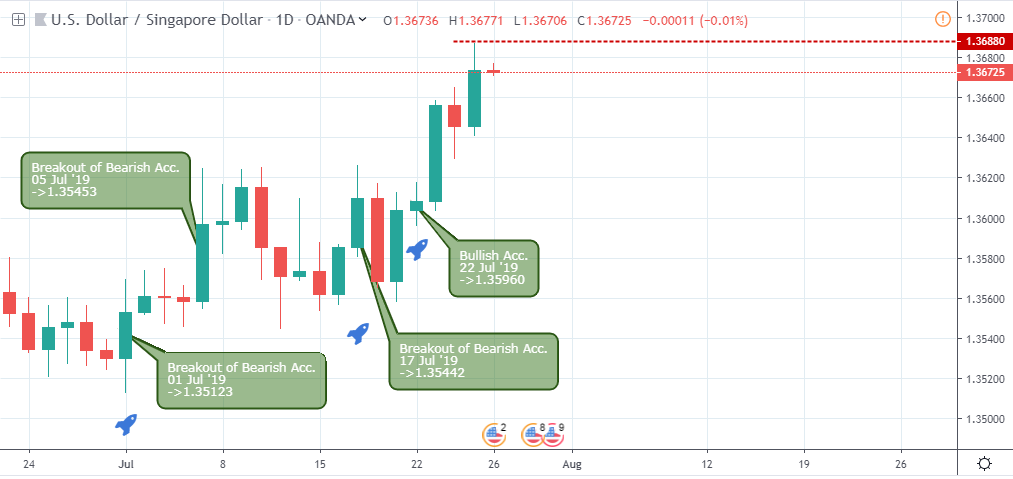
Coming to the daily time frame, resistance levels setup by sellers collapsed in the face of increasing demand for the US dollar on July 01, 05, and 17.
Consecutive daily bullish bars were flagged after the bullish support on July 22 ’19, bringing the pair to it current high at 1.36880.
USDSGD H4 Chart

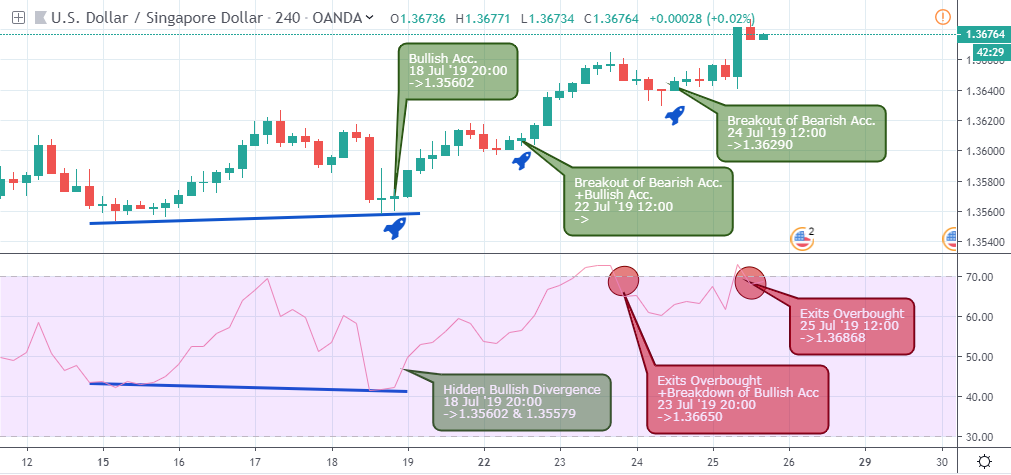
Coming closer to the intraday level, a bullish hidden divergence pattern confirmed by an increase in demand on July 18 ’19 sets the pace for a bullish upbeat.
The bullish trend continued after a breakout of resistance on July 22 and July 24, bot signals forcing the USD to SGD exchange rate into the overbought zones on July 23 and 25 ’19.
USDSGD H1 Chart
After an increase in selling pressure which led to the exit of overbought region on July 23 ’19, the bulls resumed their grip by signaling regular bullish divergence patterns on July 24 ’19 09:00 and July 25 ’19 10:00, with support levels set at 1.36290, and 1.36406.
Conclusion and Projection
This week, the Greenback has shown strength against the Asian Tiger (Singapore Dollar). Current bearish divergence pattern indicates profit taking to avoid weekend risks. Further rejection of bearish resistance, however, will show an increase in the price of the USDSGD.

- EURUSDWeekly outlook – 7th January 2022 - January 7, 2022
- BTCUSD – Weekly outlook for Bitcoin Price – 23rd December 2021 - December 24, 2021
- USDSGDWeekly outlook for Singapore Dollar – 17th Dec 2021 - December 17, 2021
Tagged with: usdsgd

