USDSGD Outlook and Technical Analysis for Singapore Brokers
Contents
Introduction
Following a series of positive macro-economic event that favors the USD, the USDSGD exchange rate soars higher on top Singapore brokers entering the new month and the current week.
Read on as we look to analyze the technical price formations, significant levels, and fundamental events.
Singapore Manufacturing PMI
The Manufacturing Purchasing Managers Index (PMI) surveys the degree of activity of purchasing managers within the manufacturing space.
When the reading goes above 50, it indicates an expansion in the sector whereas a reading less than 50 signals a contraction in the industry.
Market players monitor these surveys closely as it a leading indicator of the overall economic health of a country. Usually, purchasing managers enjoy first access to data about their company’s performance, so they bank on these data to make decisions.
When the reading is higher than expected, it signals a positive/bullish sentiment for the SGD, whereas a lower than expected reading means a negative/bearish trend for the SGD
Data released on Aug 02 shows actual reading at 49.8 while the previous data was 49.6 signaling a bearish sentiment for the currency.
U.S Non-Manufacturing PMI
The (ISM) Non-Manufacturing Purchasing Managers’ Index (PMI) is an indicator used in calculating the overall economic state for the non-manufacturing division.
The NMI, which is a compound index, is determined by the diffusion indexes of indices with corresponding weights. These indicators include New Orders, Business Activity, Employment—all seasonally adjusted—and Supplier Deliveries.
Latest data released on August 05, shows actual reading to be 53.7%, while the previous data was 55.1%. The sentiment is bullish for the USD however it is slowing.
USDSGD Technical Analysis
USD/SGD: Monthly Chart
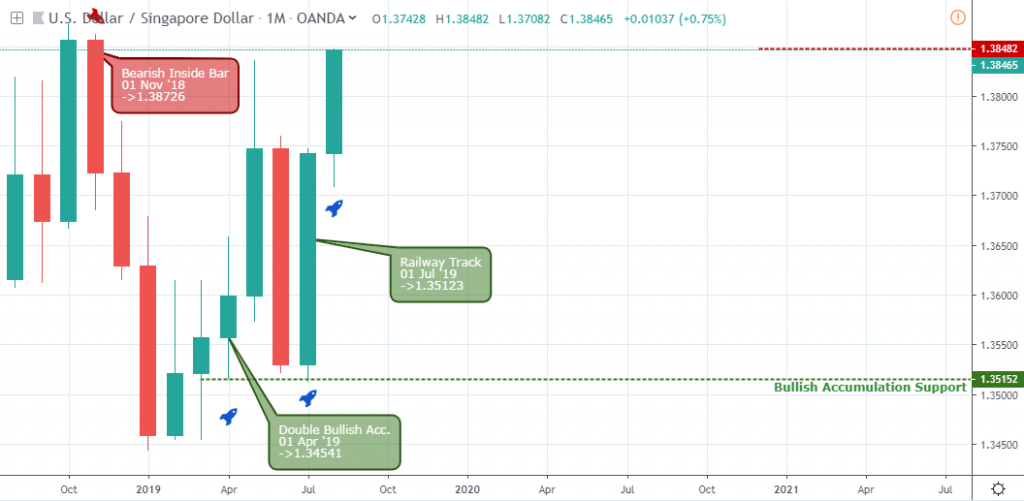
An increase in buying power is shown on April 01 following a series of consecutive bullish closing bars.
The significant support established by a collection of earlier buy orders on April 01 sets support at 1.35152, serving as a springboard for the current price surge.
Last month’s bullish bar close signaled a railway track candlestick pattern supporting a further increase in the exchange rate of the USD to SGD on major foreign exchange broker platforms.
USD/SGD: Weekly Chart
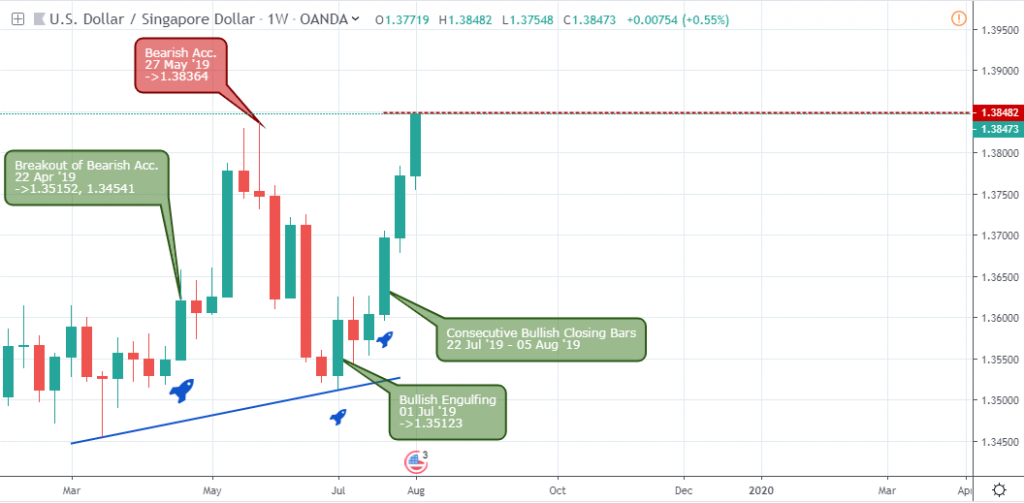
The above weekly chart of the USDSGD shows a bullish trend line connecting the breakout support (1.34541) on March 18 ’19 and the bullish engulfing support (1.35123) on July 01 ’19, projecting a series of bullish closing bars.
USD/SGD Daily Chart

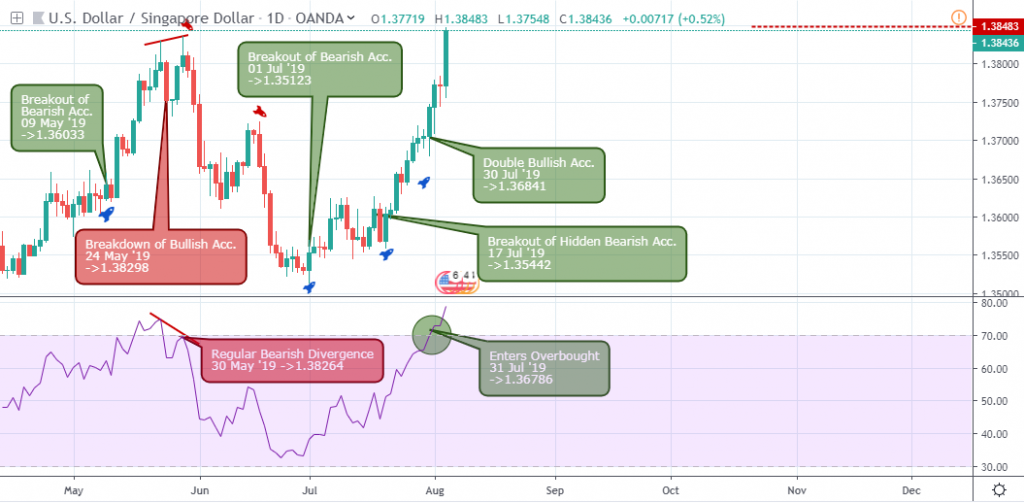
Coming down to the daily time frame, we observe lower-risk entry points into the bullish and bearish swings of the weekly and monthly time frames.
A regular bearish divergence on May 30 ’19 confirmed the 2.0% price plummet after an earlier breakdown of bullish support and exit of the overbought area.
Hovering above the RSI level-30, the USD to SGD price breaks selling resistance on July 01 ’19 for a 2.3% price increase into the overbought region.
USDSGD H4 Chart

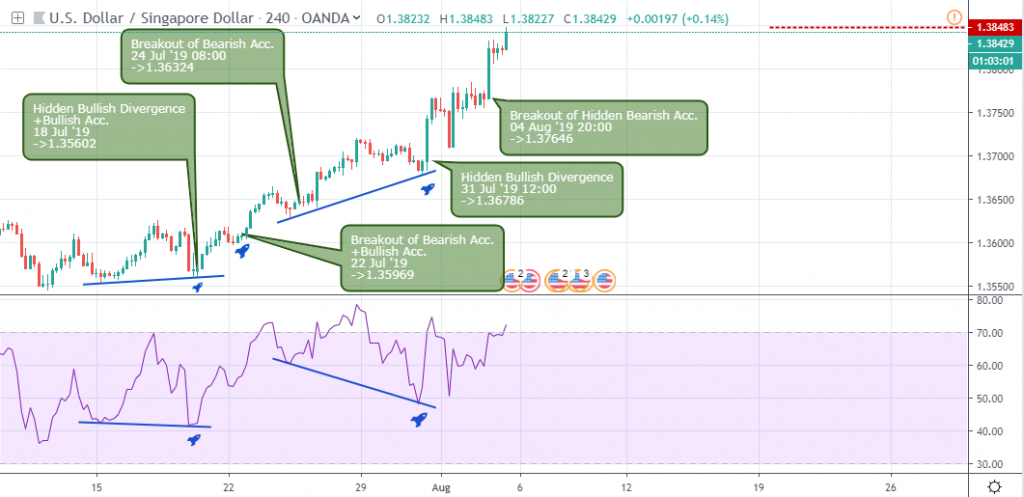
Notice the bullish and bearish swings on the 4hour chart before the price eventually broke into the bullish trend. Here, we get a clear long entry after the hidden bullish divergence pattern flagged on July 18 ’19.
Selling resistance levels collapsed to increase in buying pressure on July 22 and 24 ’19 08:00, before another hidden bullish divergence that projects the current bullish rally during the current week.
Conclusion and Projection
So far it’s been a bullish week as the USD dominates the Singapore dollar. At the current overbought level, it’s best to activate trailing stop order behind the long position and perhaps exit a percentage of the trade.

- EURUSDWeekly outlook – 7th January 2022 - January 7, 2022
- BTCUSD – Weekly outlook for Bitcoin Price – 23rd December 2021 - December 24, 2021
- USDSGDWeekly outlook for Singapore Dollar – 17th Dec 2021 - December 17, 2021
Tagged with: usdsgd


