SGD/USD weekly outlook
Contents
- The bullish trend of SGD/USD continues.
- The right conditions are ripe for a buy order for long term traders.
Over the last one year SGD/USD crypto-fiat pair, one of the most traded pair on most Singapore brokers, has been on the rise. There have been a few retracements here and there, but generally the crypto pair has registered a very strong bullish trend.
Daily Chart

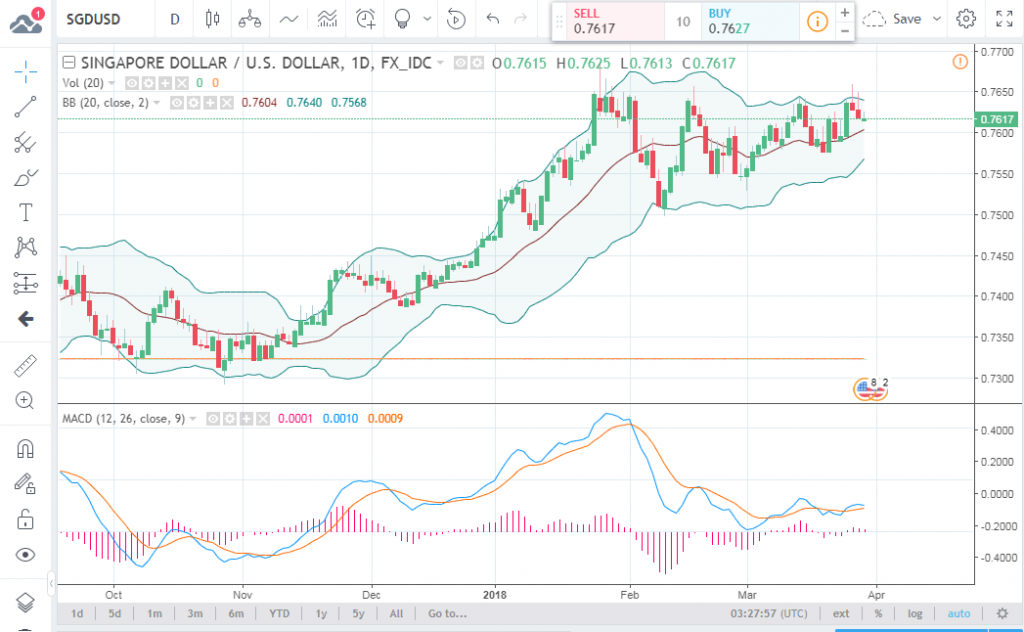
Analysing the daily chart for the short term or day traders, it is evident that the general tr4end is upward.
Nevertheless, the daily range is small. The length of the candlesticks is too short. Therefore, even if the bullish trend is quite strong, the market is not that volatile, making it the best market for day trading.
Another thing worth noting is that the market has very promising waves that day traders can utilise.
For a day trader or a short term trader, his/her joy is when the market price is swinging since that way, it will easily give him/her the entry and exit points much easily compared to a continous trend.
Applying Bollinger Bands
Applying Bolinger Bands indicator, the market price is oscillating about the middle line within the Bollinger Band. This makes the market quite predictable.
At the moment, the price is above the middle line but heading down. Therefore, it is the right time for a short term sell.
Generally, the daily trend is changing after every three to four candlestick formation,. Therefore, a sell at the current price would mean that the trader should close the sell order after the next candlestick after the currently forming candlestick is fully formed.
Applying the MACD indicator
Apparently, the MACD indicates the same thing as the Bollinger Bands. According to the MACD, it is the ripe time for a short term sell order, although with a very small target since the trend is set to reverse at any time.
Weekly chart

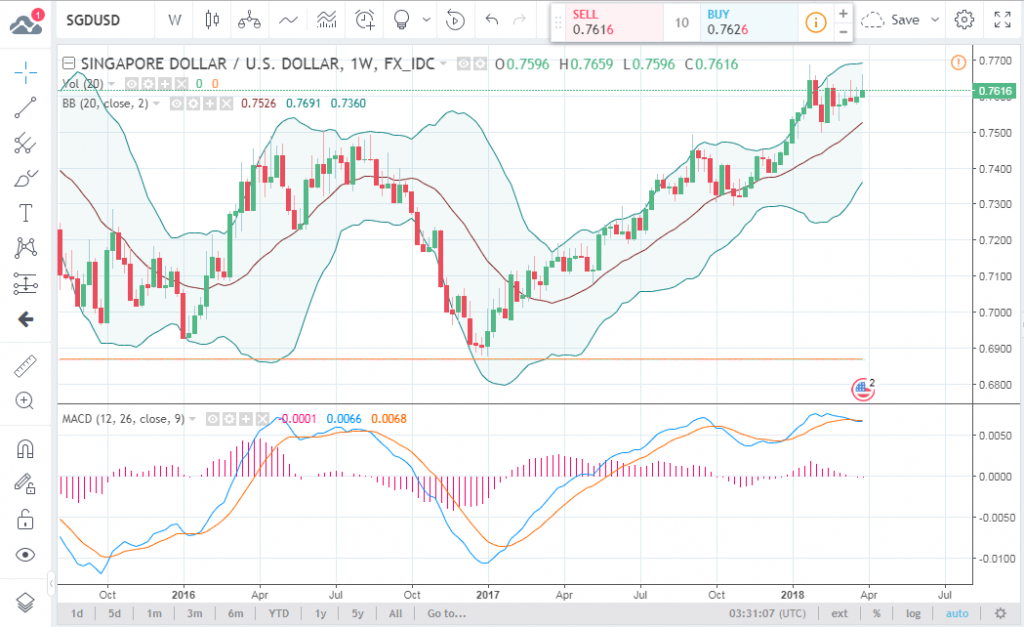
For the long terms traders, a buy order is very much in order. And for those who had opened long positions earlier, they should continue holding them as log as it takes. The conditions for a long position are still very much alive.
There was a slight retracement but the market has corrected the retracement and started to gain ground towards new heights.
Applying the Bollinger Bands
The Bolinger Bands indicator indicates that the market price is on a very strong bullish trend. The market price is way above the middle line of the Bolinger Band. This is a clear indication that the bullish trend is very strong.
With the current market conditions, traders should be very confident placing buy orders.
Applying MACD Indicator
There was a cross of the MACD lines and the red line had gone above the blue line. This is due to retracemnt which is almost fully corrected now.
The cross, however, took place near the zero level. This provides a great chance for the lines to cross yet again signalling the continuation of the bullish trend. Even with the retacemnt, it is still advisable to place a buy order on this crpto-fiat currency pair which is listed by most brokers in Singapore.
Our Recommended Singapore Brokers to trade : IQ Option
Best Regulated Broker: IQ Option

IQ Option is the world’s leading EU regulated financial broker based with a revolutionary platform for all traders. Very popular for crypto trading. Read IQOption review
- Best Trading App for Binary Options
- Minimum Deposit of only $10
- Minimum Trade of $1
- Trusted Broker
- $10,000 Virtual Funds ( Demo Account )
- Quick Withdrawals
- Outstanding Platform
- Weekly Tournaments
- Gain up to 98%*
DISCLAIMER

- EURUSDWeekly outlook – 7th January 2022 - January 7, 2022
- BTCUSD – Weekly outlook for Bitcoin Price – 23rd December 2021 - December 24, 2021
- USDSGDWeekly outlook for Singapore Dollar – 17th Dec 2021 - December 17, 2021

