SGD/USD Weekly Outlook for Singapore Brokers
Contents
Introduction
The last time we analyzed the pair USDSGD, it was making a retracement of a long-term bearish trend which was triggered by a bearish regular divergence from the monthly chart perspective. Although the pair was in a midterm upward move, we anticipated a bearish hidden divergence on the daily chart, which was later triggered by a twizzer candlestick pattern. The 65-period moving average served as a resistance level in this regard, after which the pair entered into an accumulation phase, leading to an eventual failure of the MA-65.
Fundamentals
According to Bloomberg, the Monetary Authority of Singapore makes use of exchange rate as a policy tool, rather than its interest rate. This is because Singapore economy is mainly dependent on trade, so the central bank focuses on exchange rate other than interest rate, as a way of attaining market stability. The chart below illustrates Singapore GDP share shoots way beyond the world average.
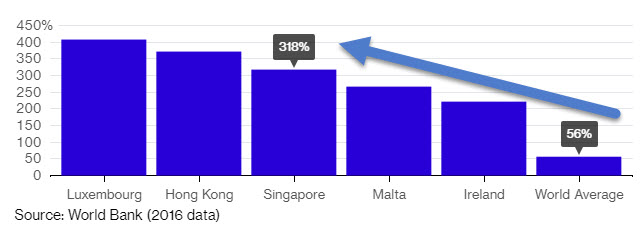
Most Singapore broker/s and speculators keep tabs on the different metrics of the MAS and anticipate the probable direction of the Singapore dollar. Making reference to another of our articles where we took a glimpse at the U.S. interest rates as it made a steadily rising trend last week. We come to a conclusion that this also accounts for the gains attained by the U.S dollar traded against the Singapore dollar.
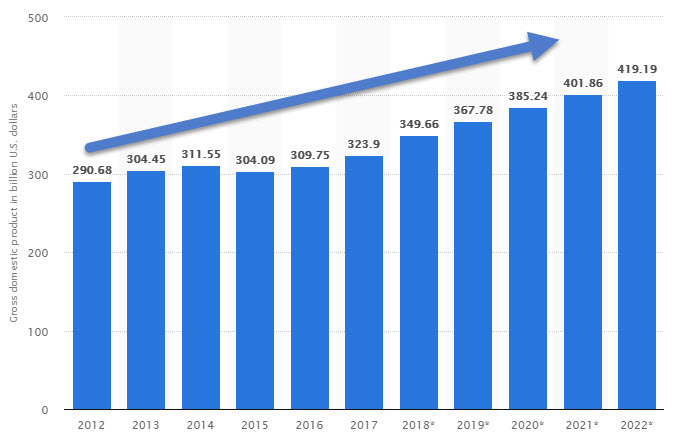
Singapore Dollar’s Rising GDP
Technical
Just as mentioned at the beginning of this article, the pair broke through a 65-period moving average on the daily chart and currently trading above it at the moment. If you’ve been following our series of articles, you will be familiar with our idea of multiple time frame analysis of currency pairs. The pair trades between the weekly and daily 65-period moving average, with the weekly’s MA-65 serving as resistance, and daily serving as support.
SGDUSD: Monthly Chart
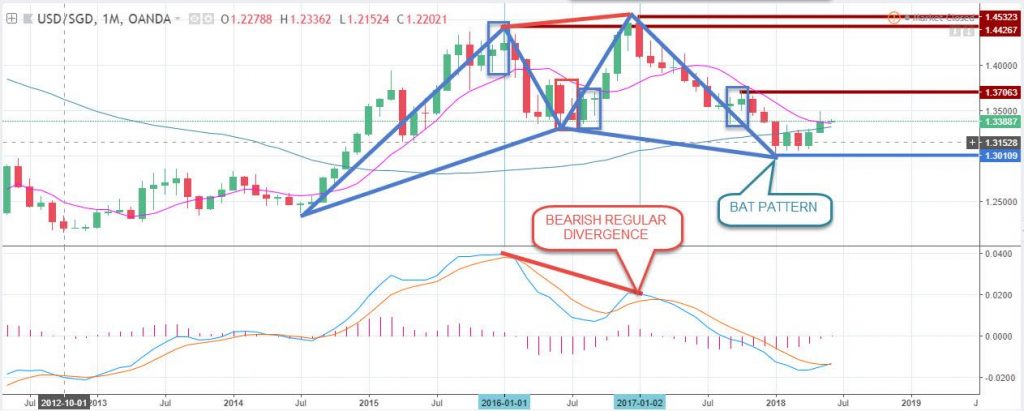
Starting from the monthly chart, the pair’s major bearish trend was triggered by the bearish regular divergence on February 2017 as illustrated in the chart above. The pair continued bearish and traded below the 65-period moving average of the monthly chart, and close below the low of 1.33134. This currently forms what appears to be a bullish bat harmonic pattern, as the pair closes back above the 65-period moving average.
SGDUSD: Weekly Chart
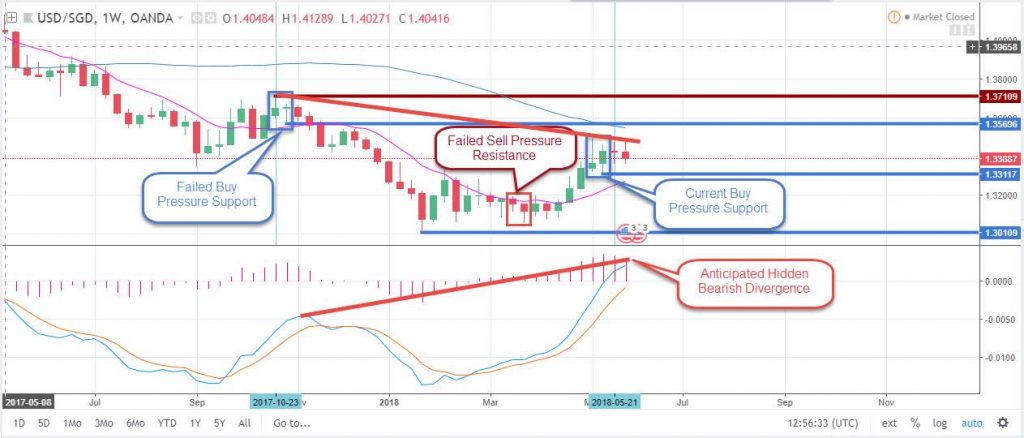
As mentioned earlier, the pair trades below the 65-period moving average of the weekly timeframe which currently serves as a resistance zone. With this formation, we anticipate a bearish hidden divergence on the weekly timeframe which could cause a strengthening of the Singdollar. The higher high of the anticipated divergence is formed at 1.37109 with a failed buying pressure formed at the same point.
Failure of sell pressure formed above the 1.30109 support level on the same weekly timeframe pushed the price of the pair higher. Following the weekly price as a benchmark, the pair currently formed a bullish buy-pressure signalling continuation of the upward. However, a failure of this bullish setup confirms the bearish hidden divergence anticipated earlier on.
SGDUSD: 4-hour Timeframe
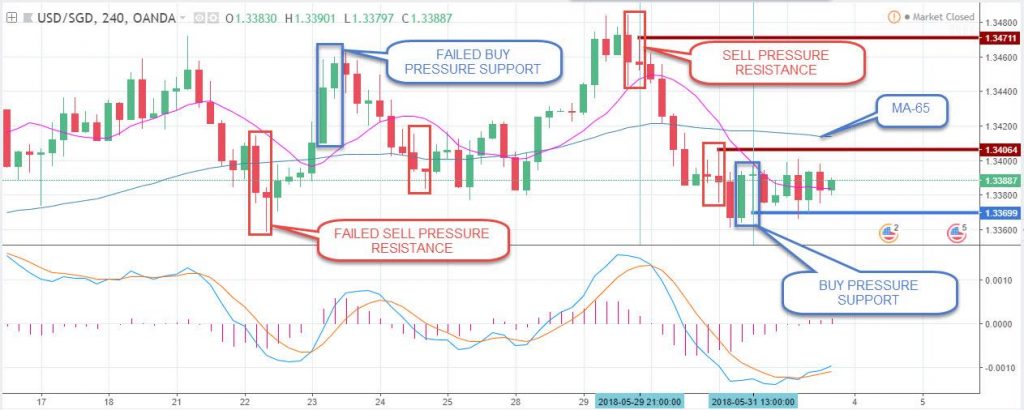
The above four-hour timeframe illustrates a closer view of the currency pair, and how swing traders have been taking advantage of the moves. It has been a rollercoaster since 22nd of last month, as Singapore brokers and traders alike witness a failure of both buying and selling pressures, causing the price to oscillate.
Projection and Conclusion
Considering the rising GDP in Singapore and using the weekly timeframe as direction, we’ll be looking forward to a failure of the buying pressure formed on the 4-hourly chart. This will be triggered by candle close below 1.33699 as well as the most recent sell pressure formed on the daily chart.
Our Recommended Singapore Brokers to trade SGD/USD
Best Regulated Broker: IQ Option

IQ Option is the world’s leading EU regulated financial broker based with a revolutionary platform for all traders. Very popular for crypto trading. Read IQ Option review
- Best Trading App for Binary Options
- Minimum Deposit of only $10
- Minimum Trade of $1
- Trusted Broker
- $10,000 Virtual Funds ( Demo Account )
- Quick Withdrawals
- Outstanding Platform
- Weekly Tournaments
- Gain up to 98%*
Best Binary Options Broker: Olymp Trade

Olymp Trade is an award winning binary options broker with an excellent trading platform support and education tools. Read Olymp Trade Review
- Risk-Free Trades
- Minimum Deposit of only $10
- Max. 90% Payout
- $10,000 Free Demo account
- Free TrainingEducation : 18 Indicators, 7 strategies and 28 webinars 25% Deposit s
- Certified Platform
- Quick withdrawals
Best Binary Bonus: Binomo

Binomo is a regulated binary broker with a wide range of assets to trade and amazing promotions ( bonus, tournaments prizes,..) .Read Binomo Review
- 25% Deposit Bonus ( 100% Bonus VIP accounts )
- Minimum Deposit of only $10
- Minimum Trade of $1
- Max. 95% Payout
- $1,000 Virtual Funds ( Demo Account )
- Weekend trading
- Free training
DISCLAIMER

- EURUSDWeekly outlook – 7th January 2022 - January 7, 2022
- BTCUSD – Weekly outlook for Bitcoin Price – 23rd December 2021 - December 24, 2021
- USDSGDWeekly outlook for Singapore Dollar – 17th Dec 2021 - December 17, 2021

