60 Second binary options strategies are very popular among investors because the fast price action offers more trading opportunities within a relatively short period of time. Moreover, most binary options traders tend to trade the market as a side gig, to generate passive income. A trade that lasts only a few minutes compared to hours can help traders apply multiple trades to generate the target profits in a day.
Today, we will be discussing a very simple 60 second binary option strategy that has huge potentials to generate large profits for binary options traders.
It is called RSI Level 30-70 binary options strategy. During our own back testing research, we have found this strategy to signal some terrific trades on the 60 second time frame.
What is Relative Strength Index (RSI) indicator?
Contents
Relative Strength Index (RSI) is a very popular technical trading indicator that tries to gauge price momentum by comparing the recent gains to the recent lows in the market. The primary purpose of the RSI is to find if the binary options market is in an overbought or oversold position.
The RSI moves back and forth between the 0 and 100 level. When the RSI indicator reading goes above 70, it indicates that the binary options market is in an overbought condition and the price of the option instrument would likely to fall.
In contrast, when the RSI reading is below 30, it indicates that the binary options market is in an oversold condition and the price would likely to go up soon.
How to Apply the RSI Level 30-70 Binary Options Strategy?
Aggressive traders often place PUT and CALL orders with their binary options brokers whenever they see the RSI reading above 70, and below 30, respectively.
However, we would like to offer some improvement over this simple strategy.
Improving the odds of the RSI Level 30-70 Binary Options Strategy
We are huge fans of price action and trading candlestick patterns. Our recommended way to trade with the RSI Level 30-70 strategy would be to wait for the price to reach a new high or low.
Once the price reverses and penetrates below or above the low or high of these bars, only then place an order in the market.
Trading Example of RSI Level 30-70 Binary Options Strategy
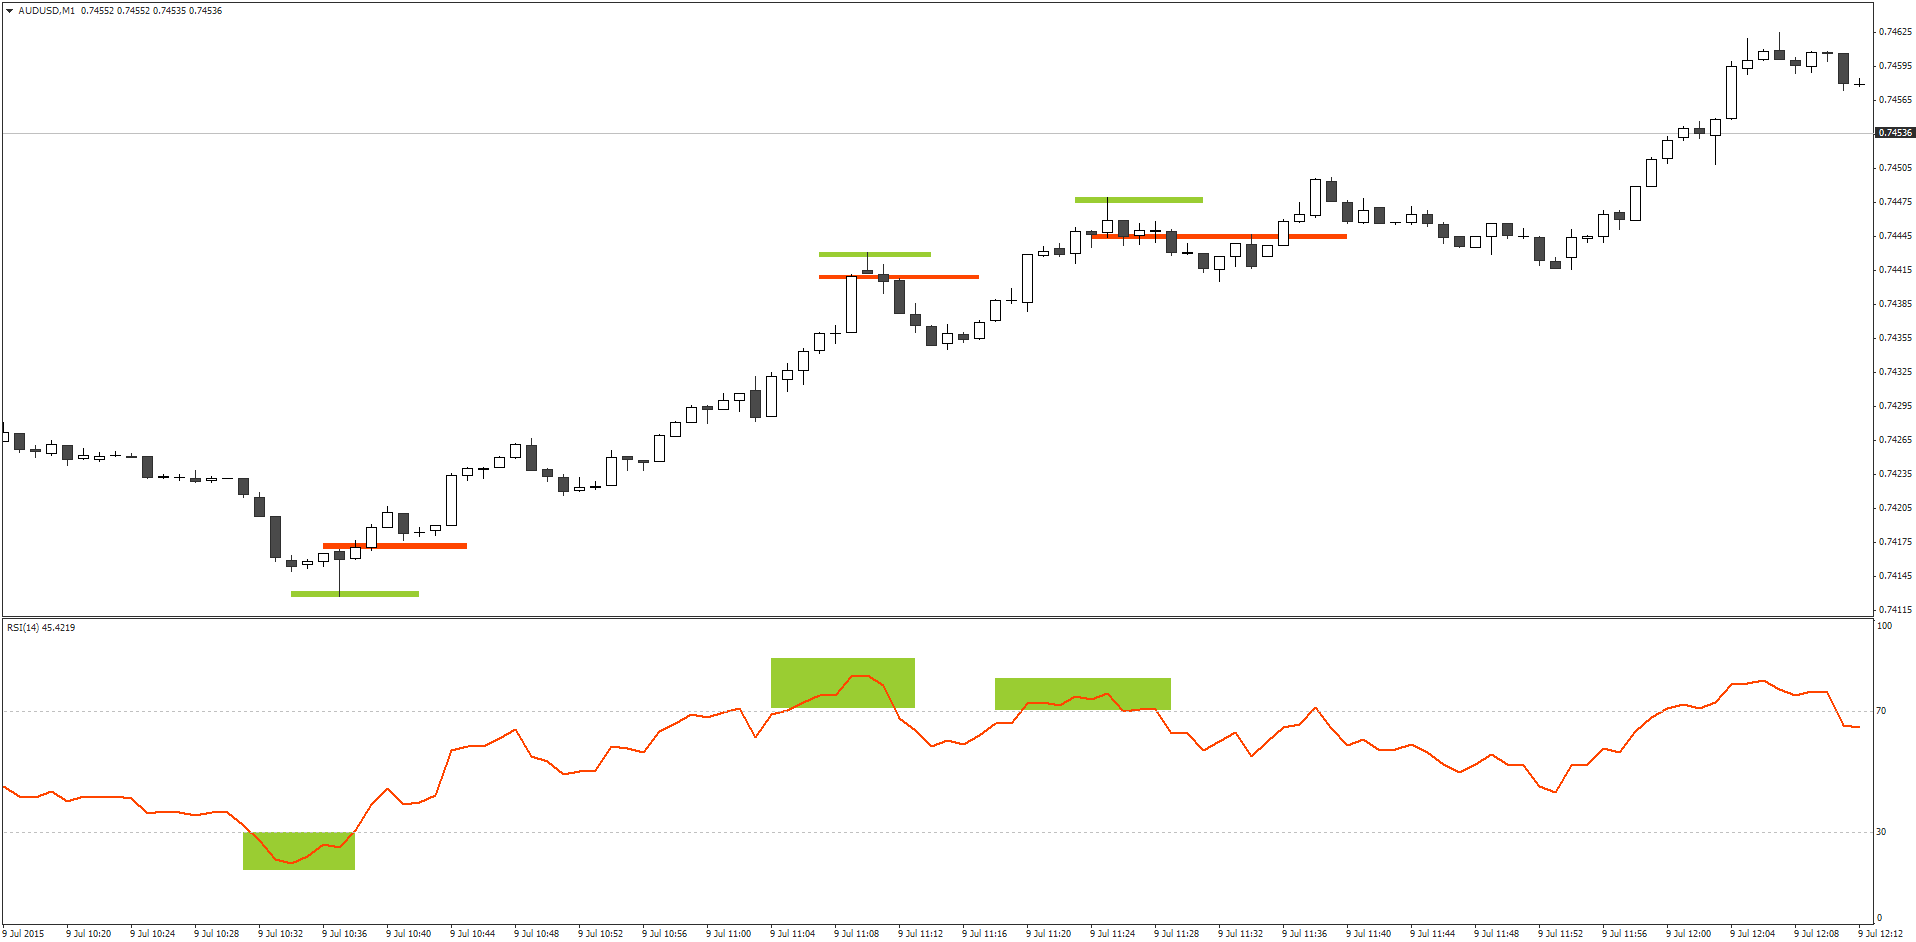
The first green block on the left in this chart shows the RSI reading below 30. Once the price reaches the lowest point, we would wait for that 1 minute (60 second) candlestick to to complete. Once the price penetrates above the high of this candlestick, we would place a CALL order with the binary options broker.
In contrast, when the RSI reading is above 70, and the price has made a new high, we will wait for the bar to close first. Then, once the price has penetrated the low of this bar, we would place a PUT order with the binary options broker.


