EUR to USD Forecast
Contents
Introduction
The EURUSD pair has seen many ups and downs during the US elections, and the rise of new cases on COVID19 in the European region is also of importance to the top online brokers as they all want a safe-haven for their investments.
Fundamentals
Euro Zone
Trade Balance: Forecast 22.3B previous 21.9B
The trade balance is an avenue to check the European region’s performance in terms of importation and exportation of goods and services in the previous month. When the area experienced a positive trade balance, more goods and services were exported from the European zones than imported goods and services.
A higher than expected result is good for the Euro, while a lower outcome is bearish for the currency.
U.S.
CORE PPI m/m forecast 0.2% previous 0.4%
The core PPI report is released every 14 days into the new month by the labour statistics bureau. The reports exclude food and energy while it measures the price change in finished goods and services that the producers have sold.
When the released data is greater than the market forecast, it is suitable for the country’s currency, but a lower outcome will mean a bearish move.
EURUSD Technical Analysis
Monthly (Bullish)
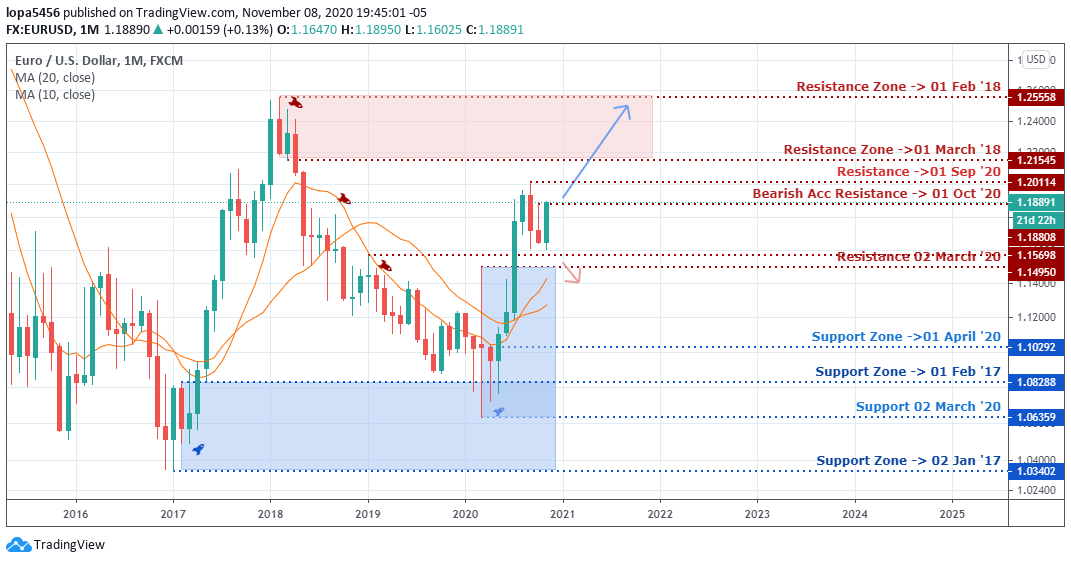
The month of November has started the week with a strong bullish run due to the US election and the market participants’ reaction. If the bullish momentum is sustained, we may see the price rise above the recent pick of 2020 (1.20114) to continue the uptrend.
The EUR to U.S Dollar pair needs to break through the resistance levels it is facing if the trend must continue, but a failure from the bull’s rally will mean that the direction will be faced with a reversal from that level for a downward movement by the Bears.
Weekly Chart Bullish
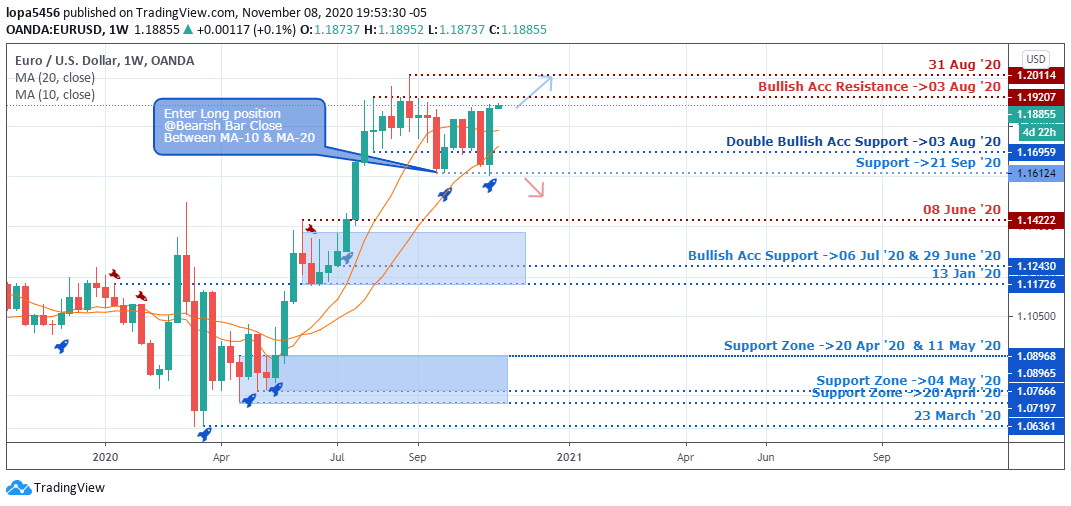
Weely Resistances: 1.20114, 1.19207
Weekly Supports: 1.12430, 1.11726, 1.16959, 1.08968
The EUR/USD pair is an uptrend looking at the weekly chart right from the low of April and May 2020 (1.08968) up to the resistance levels of 31st August 2020 (1.20114).
The weekly chart shows a stick and a bullish flag pattern, suggesting a continuation of the trend once the neckline is broken by a bullish candlestick above the 1.20114 resistance zone.
If the pair’s moves fail to rise higher, we may see a change in the direction of the trend in the coming weeks for a downtrend.
EURUSD Mid-Term Projections: Bullish
Daily Chart
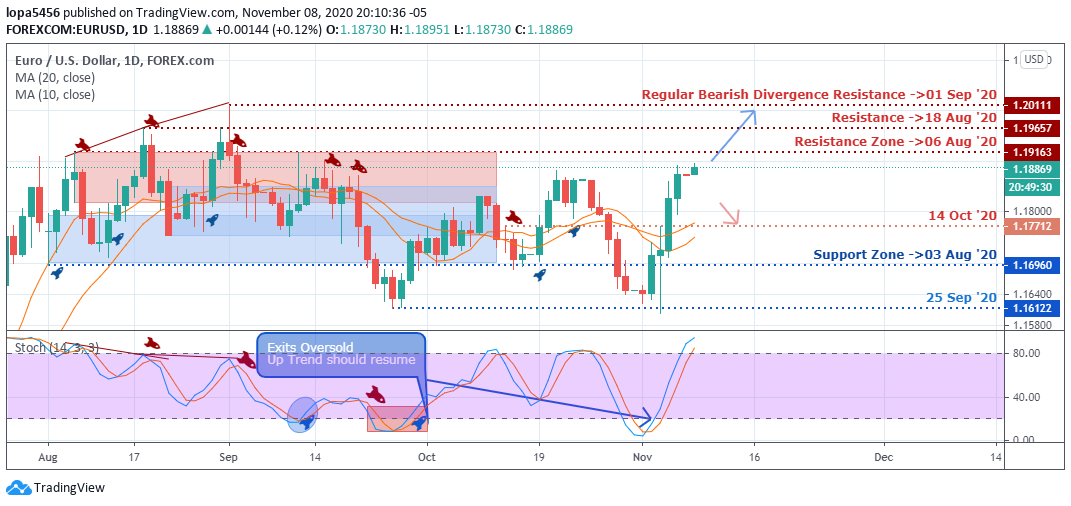
Daily Resistance: 1.20111, 1.19163
Daily Support: 1.1580, 1.16122, 1.16960
The bulls have slowed down as the EURUSD pair’s price reaches the resistance zones of 1.19163, where the bears have much dominance in the market for the past days.
The signal line of the Stochastic shows that the price is in the overbought region, and it could be an indication that the long position traders have taking profits. We may see the short position traders have place pending orders for a downward movement from the resistance zone.
H4 Chart
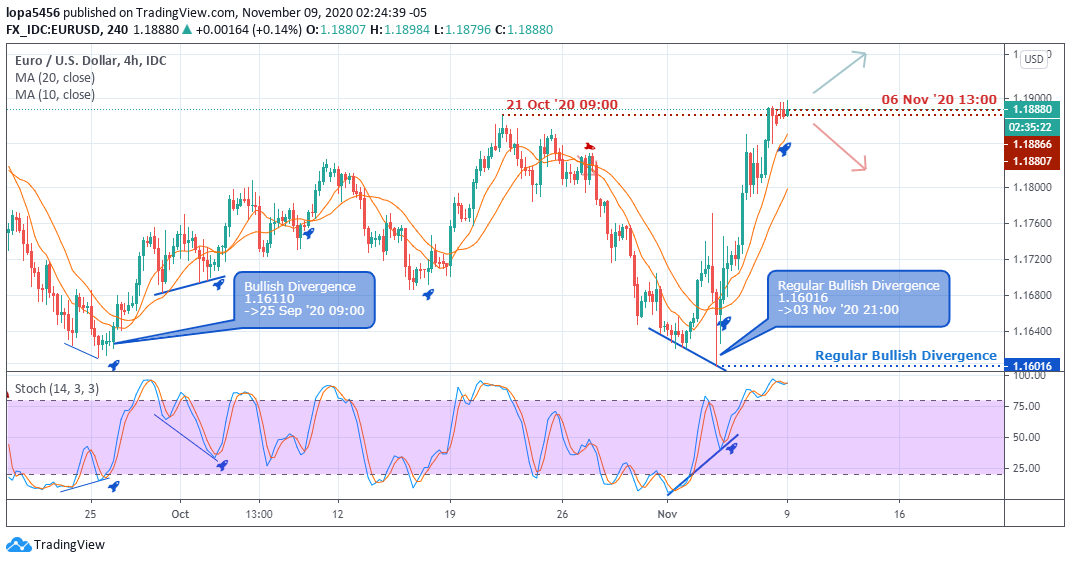
H4 Resistance: 1.8866, 1.1900
H4 Support: 1.16016
The bulls could push the EURUSD pair higher after the bullish divergence indicated the upward movement that took the price to the resistance zone of 1.8866. We may see another bullish swing to the upside if the momentum is not lost.
However, the bears may push back the price from the resistance zone because the signal line from the stochastic indicator is at the overbought zone, which will attract sellers to place sell orders for short openings that may push back the price downwards to the support level of 1.16016.
Bearish Scenario:
A general bearish scenario based on the four-hour time frame can come to play if the bears can take over the resistance level of 1.8866 for a swing low.
Bullish Scenario:
A general bullish scenario based on the weekly time frame can come to play if the price can close above the resistance of levels of 1.20144.
Conclusion and Weekly Price Objectives
The second wave of COVID-19 pandemic has led to the second lockdown of some European countries like France intending to cub the virus’s spread within the region.
If the lockdown affects some businesses, we may see a weak Euro in the coming weeks, and we shall see a bearish trend from the resistance level. However, if the bullish momentum is still strong, we may see the breaking out of the resistance zones.

- EURUSDWeekly outlook – 7th January 2022 - January 7, 2022
- BTCUSD – Weekly outlook for Bitcoin Price – 23rd December 2021 - December 24, 2021
- USDSGDWeekly outlook for Singapore Dollar – 17th Dec 2021 - December 17, 2021
Tagged with: EUR/USD


