EUR to USD Forecast
Contents
Introduction
The USD saw an increase in demand early this week, as revealed on the USD Index charts, sending the exchange rate of the EURUSD into a downward slope on IQ Option broker plataform,
A second move towards impeaching the US president Donald Trump before handing over sends uncertainties towards the Greenback, as the price drop in the EURUSD starts to slow.
The H4-TF shows a breakdown of Bullish-Acc support on Jan 06 ’21, sending the EURUSD down by -1.47%.
Although the hidden bearish divergence shows that the down move may continue, the Bullish engulfing candlestick pattern on Jan 11 ’21, offers support. It can send the EURUSD exchange rate flying through the downtrend line from the bearish divergence.
EURO and US News
The recent rise in demand for the Greenback starts to lose steam after the earlier spike in US Treasury yields.
A hike in demand for riskier assets drained the USD’s demand as a safe-haven asset, which leads to the USD hitting a two-year low this January.
The incoming Joe Biden administration’s spending expectations forced the US Treasury into new highs, seeing the ten-year yield attain a ten-month high on Tuesday.
The USD Index, a measure of the Greenback versus a basket of currencies, dropped by 0.11% from 90.38.
Fear of a double deep recession is on the rise following a role out of new lockdown measures to combat the COVID-19 in Europe.
The prolonged pandemic leading to a lockdown together with a growth in US yields boosts the dollar early this week.
Again, in the US, worries of an increase in inflation from extra spending lead to worry among investors and traders.
Global analysts anticipate a continuous decline of the USD to resume the belief that vaccine rollouts and stimulus spending will boost global economies’ outlook.
Although volatile assets like gold and Bitcoin recently made a sharp corrective decline, they still rank as one of the most favored assets to hedge against the pandemic’s uncertainties.
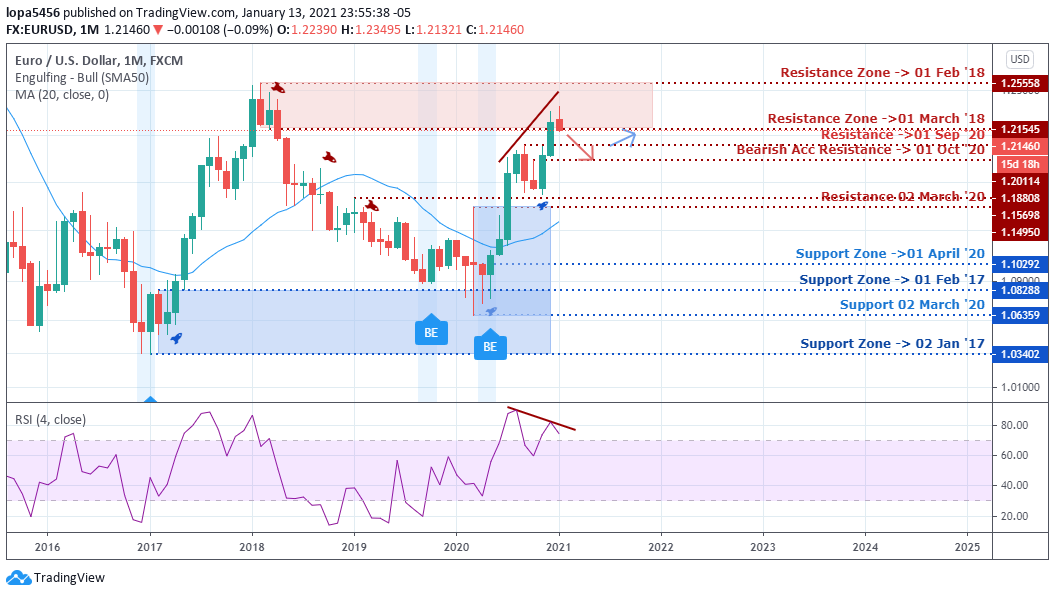
EURUSD: Monthly Chart Objective: Bullish and slowing
Upon entering into the 1.25558 and 1.21545 resistance zone, we start to notice an impending bearish divergence on the monthly-TF of the EURUSD, as the Relative Strength Index stays in the overbought territory.
A price close below the 1.21545 should define the direction of the EURUSD exchange rate to the downside.
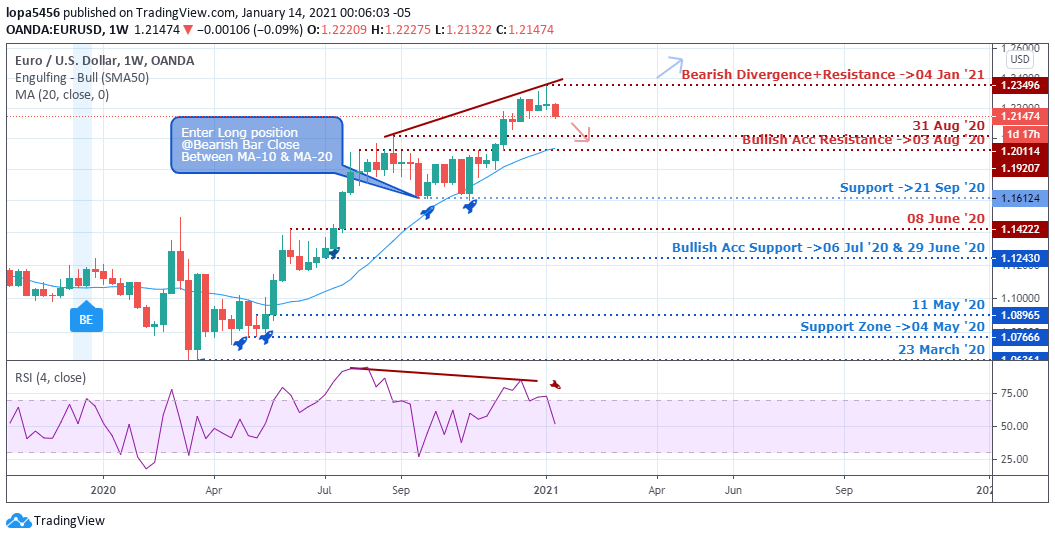
EURUSD: Weekly Chart Bullish
Following a similar path as the monthly-TF, the weekly-TF also flags a bearish divergence, this time threatening a close below significant support at 1.21931 (Jan 04’21).
Given that the RSI is also exiting the overbought level-70, the EURUSD exchange rate may correct to the MA20. The faster ten weekly Moving Average may also lead to a slowing of the impending downtrend, a level where intraday traders lock in some profit.
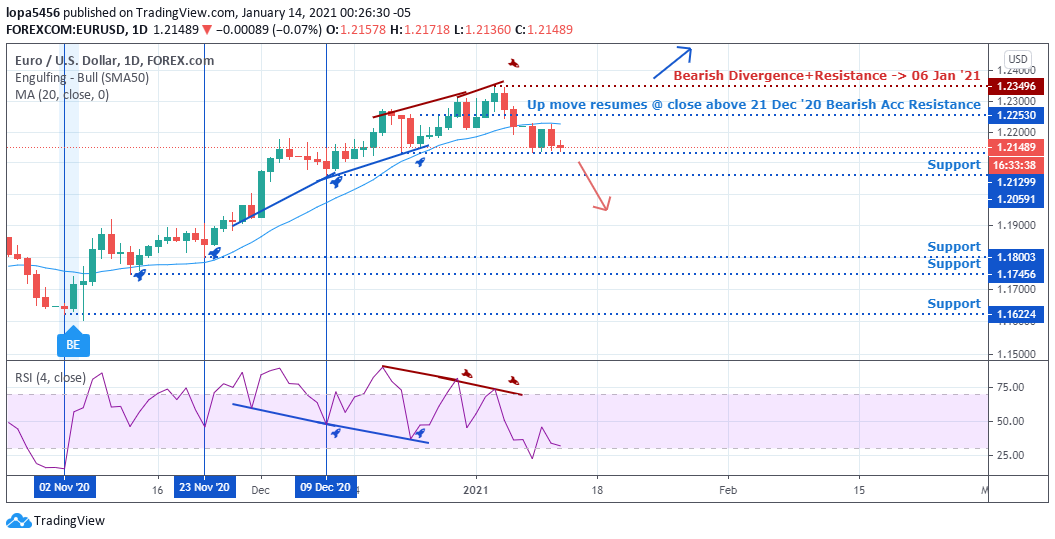
EURUSD Daily Chart Projections: Bullish
 The upward momentum starts to slow down quickly on the daily-chart as traders speculate on the US inauguration and lockdown in the Eurozone.
The chart overhead shows weakness in the uptrend of the EURUSD that should not be ignored. However, intraday chart patterns may present opportunities to scalp-trade in the up direction.
If the bulls succeed at forcing the EURUSD exchange rate beyond the 1.23496 resistance, we can be confident that the bears have given up on the chances of redeeming the USD.
Conclusion and Weekly Price Objectives
As demand for the USD grew in the four out of five trading sessions at press time, analysts believe that the US stimulus’s effect is already priced in.
Recent growth in bearish USD positions may send the Greenback plummeting into a downward spiral in the long term. However,

- EURUSDWeekly outlook – 7th January 2022 - January 7, 2022
- BTCUSD – Weekly outlook for Bitcoin Price – 23rd December 2021 - December 24, 2021
- USDSGDWeekly outlook for Singapore Dollar – 17th Dec 2021 - December 17, 2021


