BTCUSD Weekly Review for Cryptocurrency investors
Contents
- The crypto-fiat pair completed last week with a bearish candlestick of an average weekly range of 1390.03.
- The BTCUSD slid past the support at 8074 and later pulled back up to 8197.
- Last time the support prevented the crypto-fiat pair from sliding further down, resulting to the formation of a bearish hammer candlestick (that is 6 weeks ago).
What to expect this week
For this week, traders should keep their eyes on the support at 8074 and also the resistance at 8400. This is a crucial week for BTCUSD for the pair may plunge lower than the current price level and this is castigating fear among most cryptocurrency investors since Bitcoin is normally seen as the compass of the cryptocurrency markets; it sets the pace for the rest of the crypto coins.
Bitcoin price has experienced a drop since mid-December 2017, although there were signs of a bullish trend three weeks ago. Only to be thwarted by the last two weeks bearish candlesticks which pushed the price back to the lowest price it hit during the downfall.
For this week, the main agenda will be to monitor the support at 8074.
Weekly chart

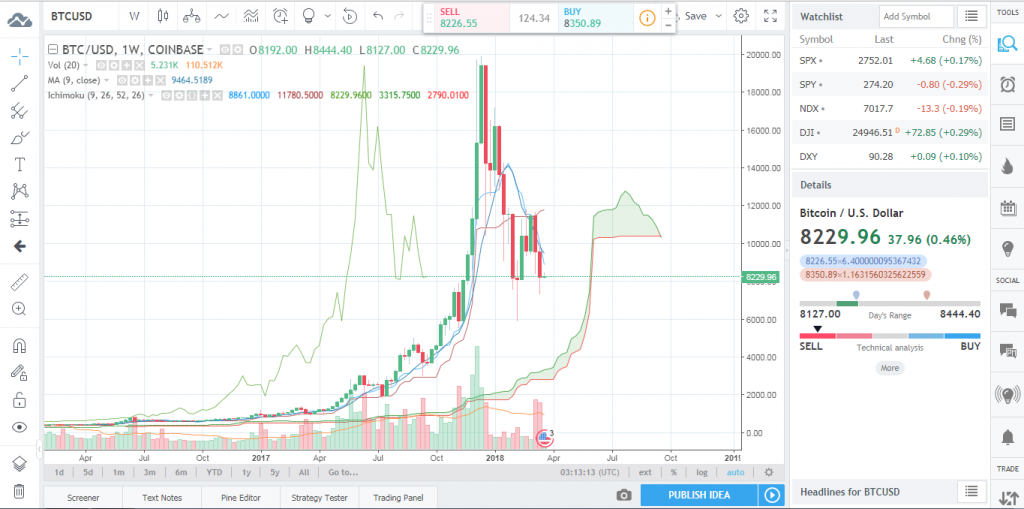
The price is already below the moving average and this indicates a bearish trend, although not very strong since the prices/candlesticks are still above the Ichimoku cloud. Again, the red Ichimoku band line is still below the green band line. This is not the best time to buy Bitcoin. If you must buy, then hold your horse and wait for the pair to show a perfect opportunity to do so.
At the moment, Bitcoin price is in a bearish trend and if you buy Bitcoin at the current price you may end up making losses.
For Long term traders, it is advisable to have patience.
If the 8074 support level is broken, you can comfortably sell with your eyes on the next support level at 7890. But in case the market decides to retrace back up at the 8074 support, then buying Bitcoin would be in order at that time, with the target at 11498 due to the previous market swing.
Daily chart
For the day traders and also the short term traders, they should look at the daily chart.

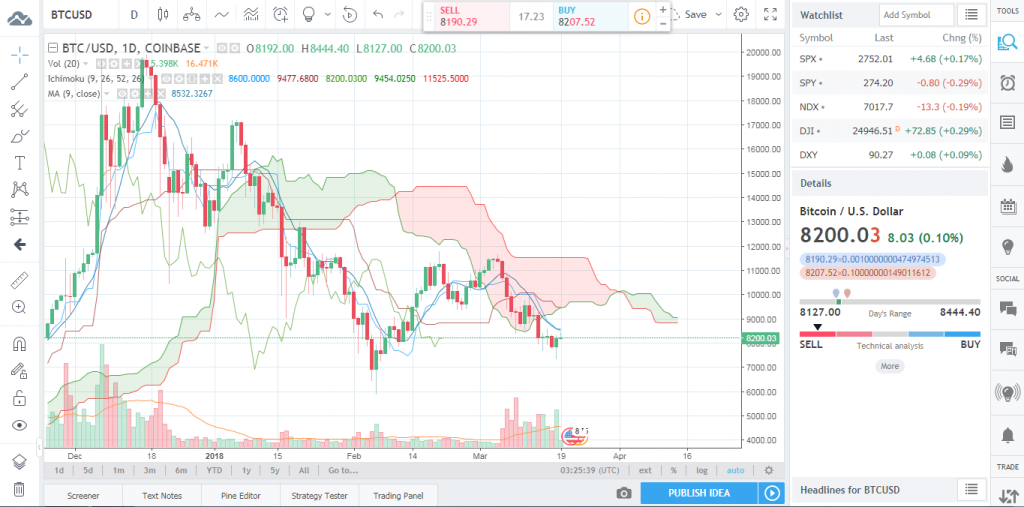
Looking at the Daily chart, you will realize that the average daily trend is bearish, although yesterday there was a small bullish candlestick that was formed.
Looking at the Ichimoku cloud indicator, the price is already below the cloud and the red band line is above the green band line. The bearish trend is confirmed by the Moving Average. The MA is above the current candlestick.
However, traders should not the hammer candlestick that was formed on 18th. This indicates a probable upward movement. If the current candlestick closes as a bullish candlestick, then traders can place a short term buy targeting around 300 points since that is the average candlestick range.
For the day traders or short term traders, they have an advantage since the BTCUSD is very volatile and there are quite a number of swings. Identifying the right candlestick patterns like hammers and doji candlesticks would help them trade profitably.
Our Recommended Bitcoin Broker for Cryptocurrency Investors : IQ Option
Best Regulated Broker: IQ Option

IQ Option is the world’s leading EU regulated financial broker based with a revolutionary platform for all traders. Very popular for crypto trading. Read IQ Option review
- Best Trading App for Binary Options
- Minimum Deposit of only $10
- Minimum Trade of $1
- Trusted Broker
- $10,000 Virtual Funds ( Demo Account )
- Quick Withdrawals
- Outstanding Platform
- Weekly Tournaments
- Gain up to 98%*
DISCLAIMER

- EURUSDWeekly outlook – 7th January 2022 - January 7, 2022
- BTCUSD – Weekly outlook for Bitcoin Price – 23rd December 2021 - December 24, 2021
- USDSGDWeekly outlook for Singapore Dollar – 17th Dec 2021 - December 17, 2021

