Weekly Outlook of ETHUSD – Ethereum price
Contents
The month of February has been a bearish one for major cryptocurrencies traded against the United States dollar, and Ethereum is not left out of this recent happenings. Paired against the U.S dollar, Ethereum market capitalization has recently been establishing weekly lows in correlation with the lower weekly close prices of the pair. The U.S dollar continues to dominate Ethereum in the previous weeks following similar patterns as Bitcoin vs. U.S dollar. Market Cap based on data from ether scan drops from US 134.21 billion with the average price per ether at $1385.02.
For those of you crypto lovers out there who are looking to buy Ethereum either as speculators operating a margined account or for storage in a wallet, it’s better you don’t try catching a falling knife. Please read on as I disclose reasons why you should hold on for a while till the dust is settled.
Looking at fundamentals, we will mainly focus on the demand for Ethereum [Ether].
Speculative Demand for Ethereum
Like most cryptocurrencies in the space, speculative demand is the highest. In previous weeks, the volume in U.S dollars is steadily losing steam as shown in the chart below. Eth volume in U.S dollars continues to trend lower than 50K U.S dollar from the beginning of February till date.
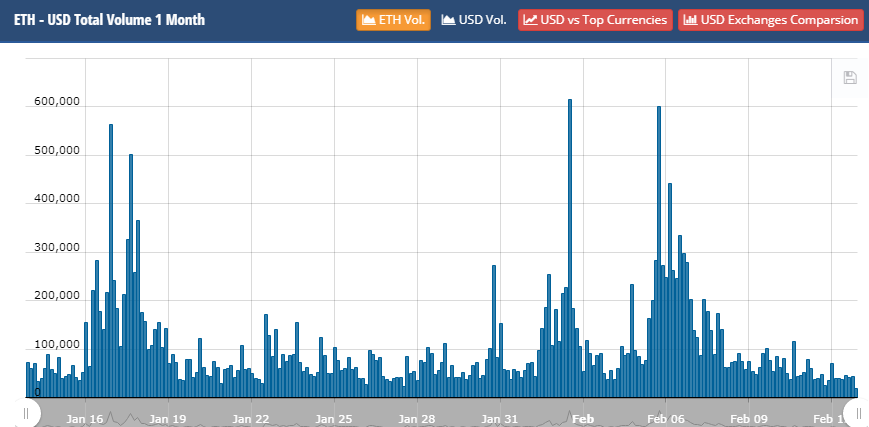
Chart courtesy: cryptocompare.com
The following doughnut chart shows where the volumes of ETH are coming from based on currency and Exchange. We can clearly see that most of it are traded against the United States dollar. The exchanges with a large chunk of the pie are also U.S based exchanges.
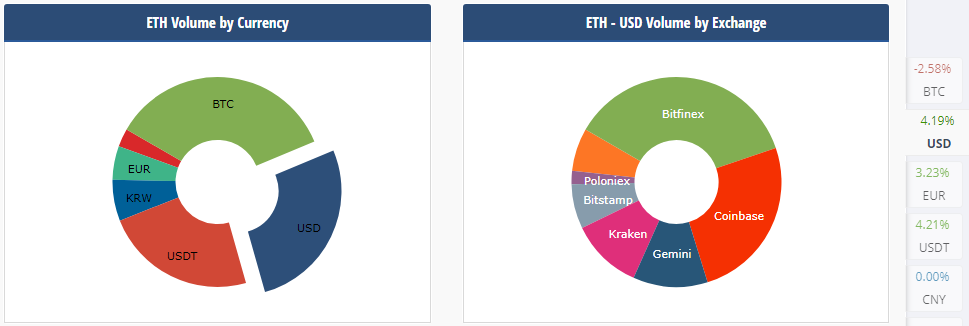
Chart courtesy: cryptocompare.com
Ethereum transaction chart & daily transaction fees
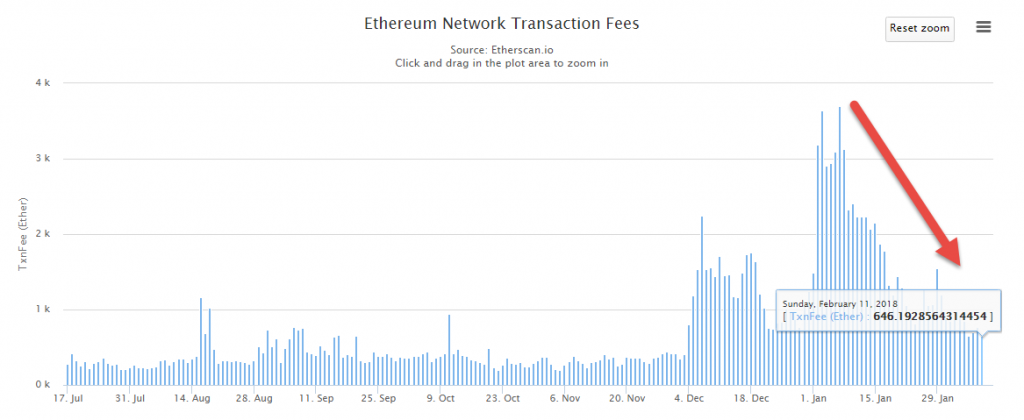
Another form of demand can be viewed through the Ethereum transaction chart, which plots date against the number of transactions per day. The daily transaction is a strong indicator illustrating the demand for services on the Ethereum network. This could be as a result of rumoured congestions on the network.
Pending Transactions
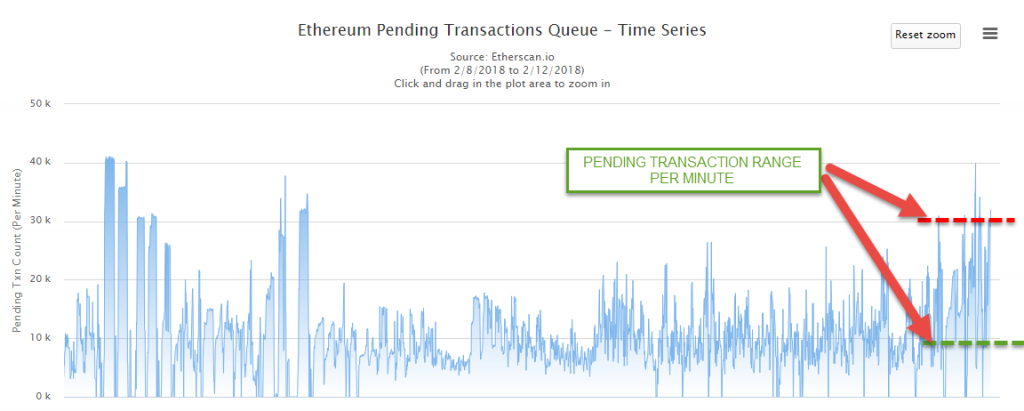
We continue to see pending transactions on the network oscillate between a range of 10k and 30k as shown below. This could contribute to drying up demand for Ether.
Technical Analysis
Haven gone through the fundamentals of demand on the Ethereum network, let’s move on to the technical analysis, which we consider as gatekeeping.
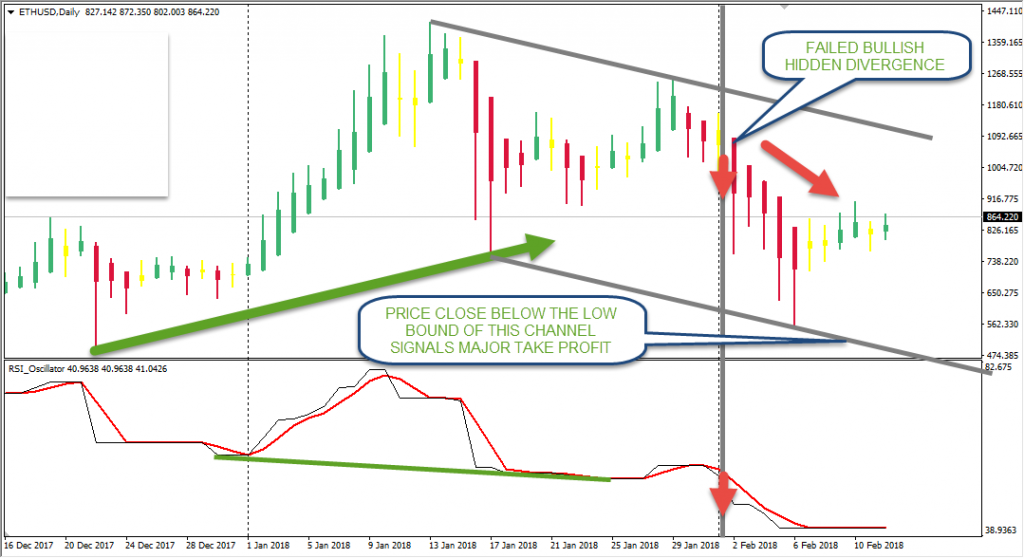
The ETHUSD pair followed a similar pattern as the BTCUSD on the daily time frame.
Hidden bullish divergence on the daily Ethereum chart did a failure swing of the divergence pattern, similar to that of BTCUSD. Ever since that point, the pair continued to close consecutively lower than the recent weekly closing prices for 4 weeks in a row.
Weekly Ethereum Chart: Showing sell-pressure
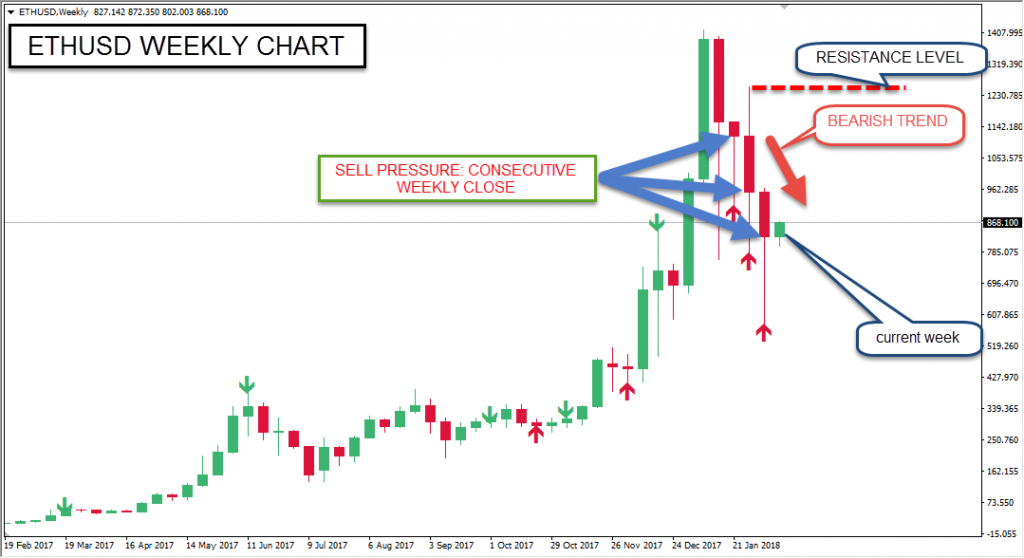
The red upward pointing arrow on the Ethereum chart above indicates huge sell pressure. A candle close above the Resistance level at $1255.199 represented by a red dashed horizontal line implies an end of the bears, and consequently a change in polarity.
Daily Chart ETHUSD: Failure swing of Hidden Bullish divergence
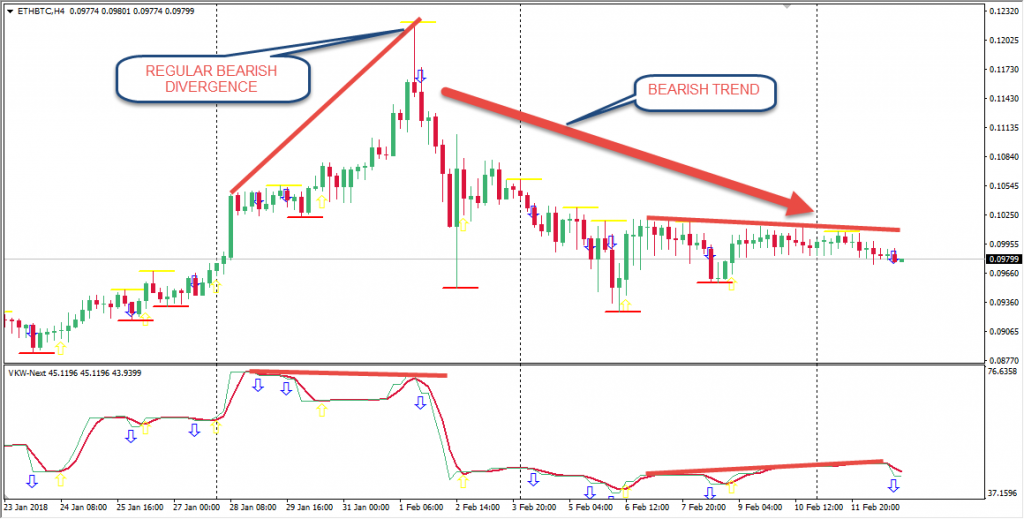
Regular bearish divergence on 4hr chart of ETHBTC
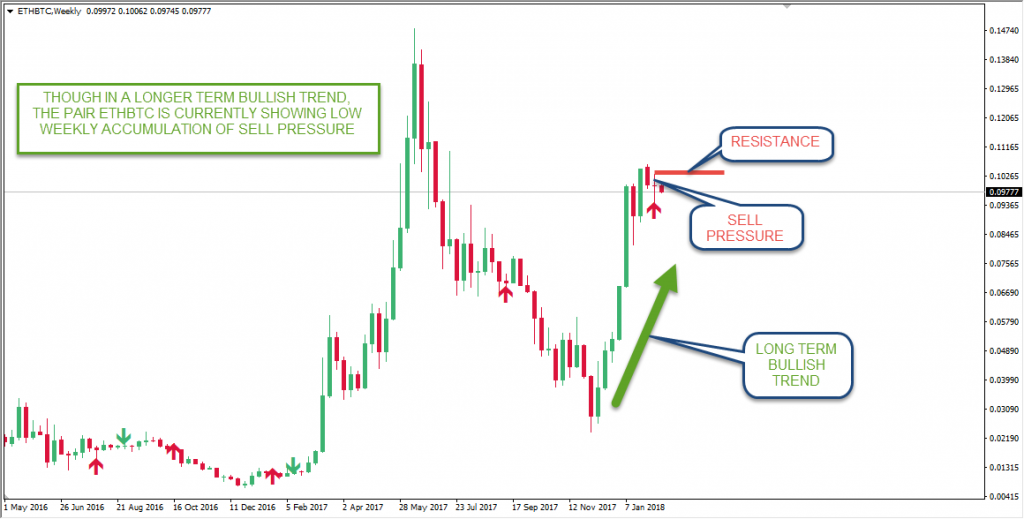
Ethereum traded against Bitcoin also signalled a divergence pattern 2 weeks ago. This is also followed by a price action sell pressure setup on the weekly chart. These formations indicate a further weakening of the Ethereum price.
ETHBTC: 4-hour chart showing sell-pressure
ETHBTC: Weekly chart showing low sell-pressure
Conclusion
Considering the above fundamental and technical analysis, we have come to a conclusion that the demand for Ether is currently shrinking, hence more demand for the U.S dollar. This week should be another bearish one for the ETHUSD pair, where ethereum price could close lower than last weeks close. However, should Ethereum price make a weekly close above the $1255.199 resistance level, it will signal a change in polarity, only then or a bullish cross of the oscillator must we buy Ethereum.
Our Recommended Bitcoin Broker to trade ETHUSD: IQ Option
Best Regulated Broker: IQ Option

IQ Option is the world’s leading EU regulated financial broker based with a revolutionary platform for all traders. Very popular for crypto trading. Read IQOption review
- Best Trading App for Binary Options
- Minimum Deposit of only $10
- Minimum Trade of $1
- Trusted Broker
- $10,000 Virtual Funds ( Demo Account )
- Quick Withdrawals
- Outstanding Platform
- Weekly Tournaments
- Gain up to 98%*
DISCLAIMER

- EURUSDWeekly outlook – 7th January 2022 - January 7, 2022
- BTCUSD – Weekly outlook for Bitcoin Price – 23rd December 2021 - December 24, 2021
- USDSGDWeekly outlook for Singapore Dollar – 17th Dec 2021 - December 17, 2021
Tagged with: ethereum

