BTCUSD Outlook & Technical Analysis for Bitcoin
Contents
Introduction
Bitcoin BTC price hits $8K mark on IQ Option terminals, a first since the price surge of Oct 25.
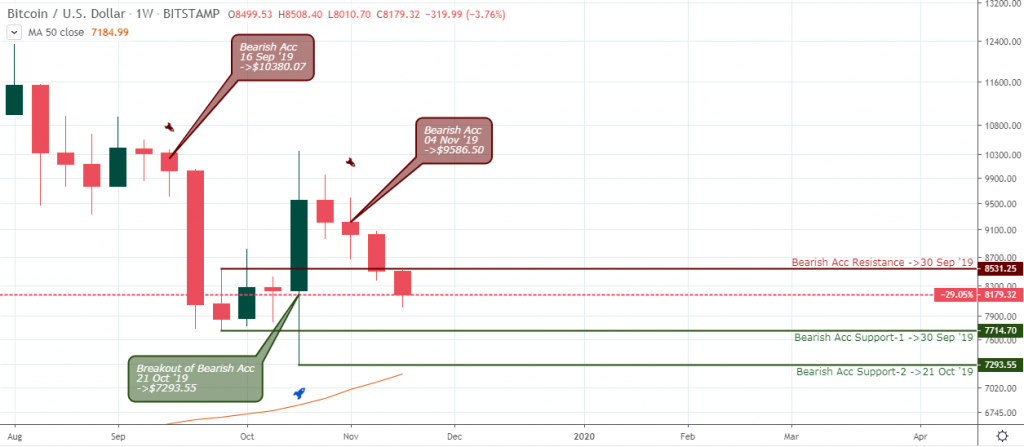
Though the midterm overview shows more bearish control, the $7714.70 threshold may hint support to renew the bullish trend.
The Significant Resistance ($9586.50) from the weekly chart proves to be very solid. Let’s
BTCUSD Technical Analysis
Weekly Chart
Resistance: $10955.48, $10380.07, $9586.50, $10350.00
Support: $8531.25, $7714.70, $7293.55
Daily Chart
Resistance: $9586.50, $9448.19, $9142.33, $8872.47, $8631.60, $8197.77
Support: $7989.15, $7293.55
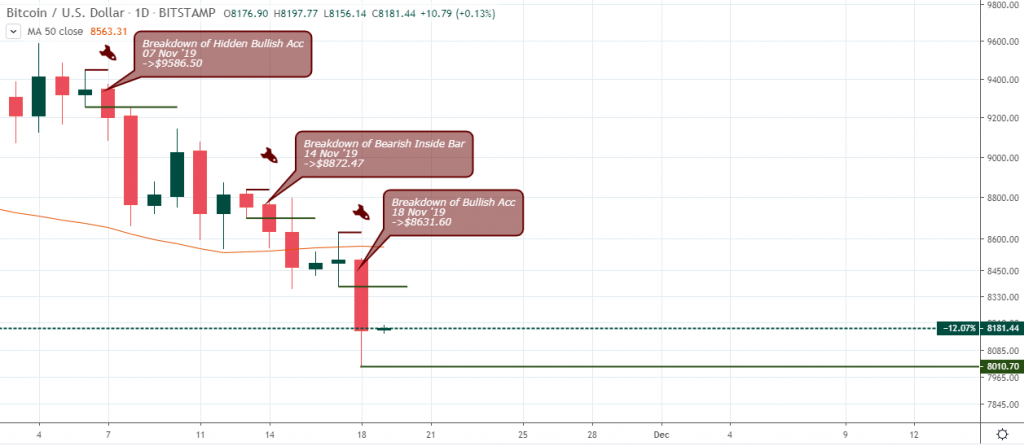
From a daily chart view, the Bitcoin to Dollar trades with the oversold zone, hovering below level-30 of the Stochastic oscillator after a rejection of $9121.2 support on Nov 08.
If the %K and %D of the stochastic oscillator cross above the level-30, and perhaps close beyond $912.2, we should get a confirmation for a bottoming.
A price close below the Nov 17 buying support $8375.00 level indicates a strong bearish presence.
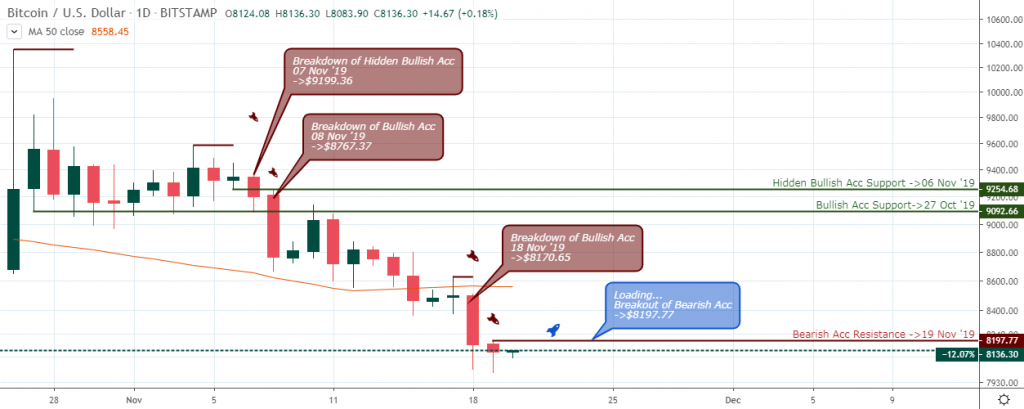
HODLers hope for a recovery in Bitcoin price is hinged on a surge beyond yesterday’s resistance $8197.77. If that happens, we should expect a rally towards the $9K round-number resistance.
Meanwhile, the BTCUSD maintains a bearish outlook.
4Hour Chart
Resistance: $8872.47, $8806.26, $8791.78, $8675.31, $8799.03, $8631.60, $8150.33
Support: $801070, $7989.15, $7293.55, $7356.00
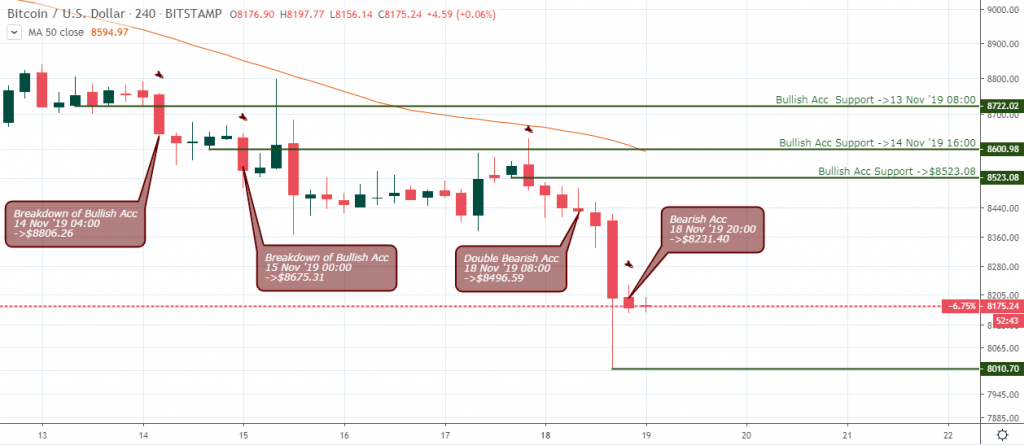
Yesterday’s bullish heap at $8375.00 of the daily horizon slipped to an increase in seller influence on the 4hour time frame, as shown above.
Dual bearish resistance $8496.59 & $8493.20 on Nov 18 04:00 & 08:00 sent the BTC price below the $8K round-number mark.
After the collapse of bullish accumulation support (H4) on Nov 13 08:00 and 14 16:00, the Bitcoin BTC signals a first bullish setup on Nov 16, 20:00.
The daily time frame, however, signaled an inside-bar pattern, showing indecision at this point.
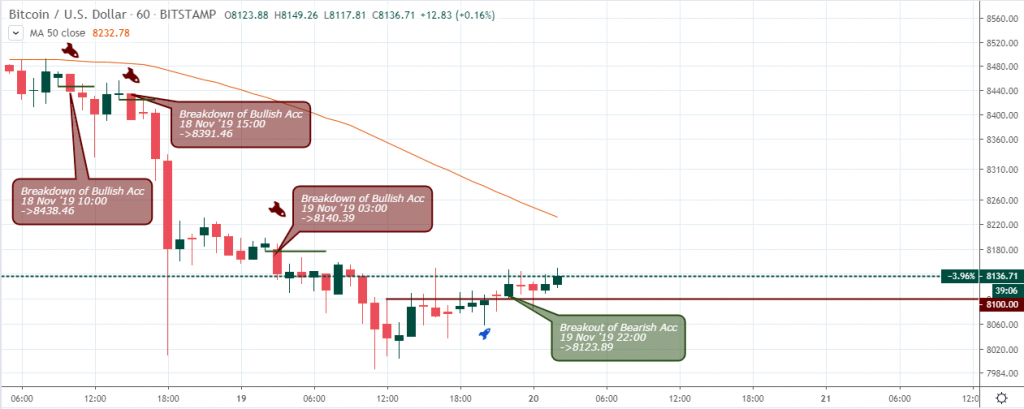
1Hour Chart
Resistance: $8872.47, $9142.33
Support: $8549.00, $8593.00
From
Bitcoin Fundamentals
Hacker offers $100k worth of BTC as Price for Hacking Big Firms
A mysterious hacker Phineas Fisher will pay up to $100,000 in cryptocurrency to black/white hat hackers for uncovering some negative information regarding high-profile global institutions.
According to a report by Vice on November 17, the hack targets big businesses such as American oil company Halliburton and Israeli spyware vendor NSO Group.
Other targets of the hack include livestock and mining companies in South America.
The goal of the prevailing bounty, which is dubbed “Hackvist Bug Hunting Program,” is to reward other hackers who conduct politically inspired hacks that will lead to public divulgence of records in the interest of the public against big firms.
The anonymous Phineas Fisher, which is believed to be an individual or a group of people, has promised to pay hackers in cryptocurrency such as Bitcoin (BTC).
The hacker stated that his intent was not enriching anyone, but to provide enough funds for hackers to make a good living doing decent jobs.
Conclusion and Projection
The only sign of a bullish trend is on the 1hour time frame as it display the bulls breaking above resistance $8100.00 on November 19 20:00. We understand from experience that the lower intraday time frame is not sufficient for a price recovery to the upside. Perhaps a break above resistance on the mid-term to long term time frames carries more weight across Singapore broker sites.

- EURUSDWeekly outlook – 7th January 2022 - January 7, 2022
- BTCUSD – Weekly outlook for Bitcoin Price – 23rd December 2021 - December 24, 2021
- USDSGDWeekly outlook for Singapore Dollar – 17th Dec 2021 - December 17, 2021

