BTCUSD Outlook & Technical Analysis for Bitcoin
Contents
Introduction
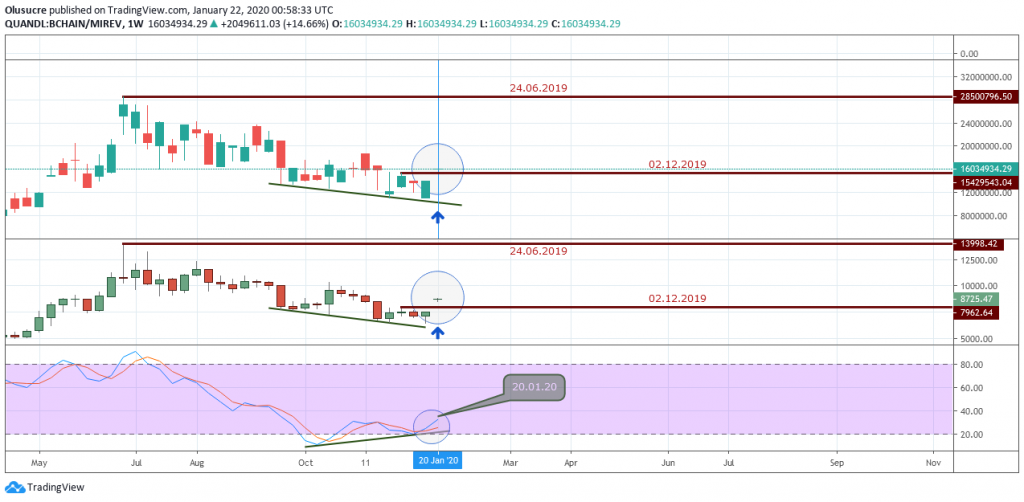
A swift increase in miners’ revenue illustrated on the weekly chart of the weekly chart MIREV shown below, ignited a rise in demand for Bitcoin BTC on major bitcoin broker and crypto exchange platforms in general.
The price hike in the BTC consequently saw some of the altcoins in the top ten cryptos by market cap pushing in the same direction.
This week, we’ll be analyzing the different chart patterns that put the bulls in the driver’s seat while also touching on some other exciting news events.
Weekly Increase in Miners’ Revenue
Bitcoin to USD Technical Analysis
A weekly chart overview of the MIREV
Monthly Chart
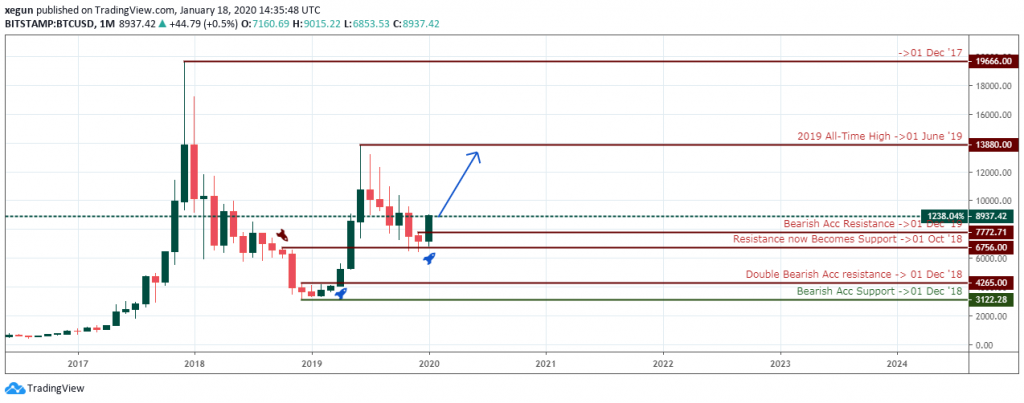
The Bitcoin price distinctly floats beyond the Dec ’19 ($7772.71) bearish resistance, with strong potential of closing above at month-end.
If the BTC price breaches the significant monthly resistance, we should anticipate a price increase similar to the break of the Apr ’19 ($4265.00) resistance, which accurately timed the bottoming of the 2018 bearish trend.
See how the resistance in Oct ’18 holds as support for the ’19 price change, confirming a turn in polarity.
The price objective upon close beyond the significant resistance would be the all-time high of ’19 ($13880.00).
Weekly Chart
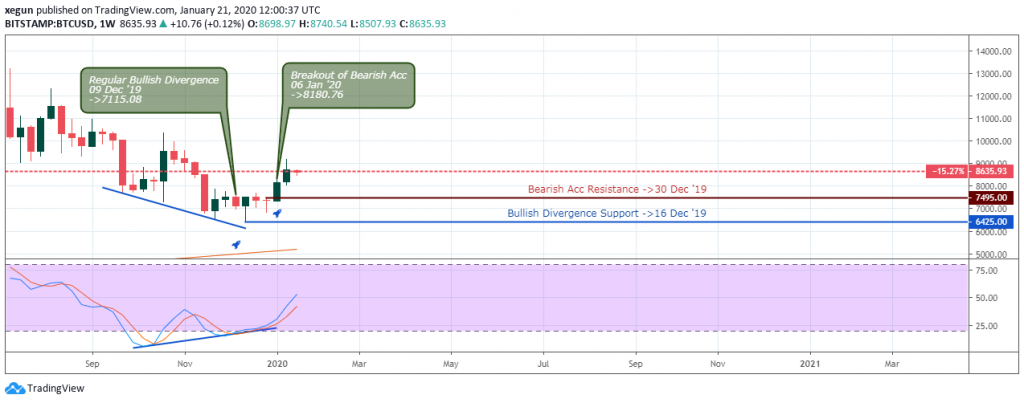
The Bitcoin to dollar rate has been closing and establishing higher highs since the crypto pair signaled a regular bullish divergence on Dec 09 ’19.
A further price close above the weekly resistance at $7495.00 confirmed the upbeat campaign, suggesting long-only trades.
However, this week, we see a slowing of the upward price move. We move to the daily time frame for insights into the chart patterns or indicator resistance zones.
Daily Chart
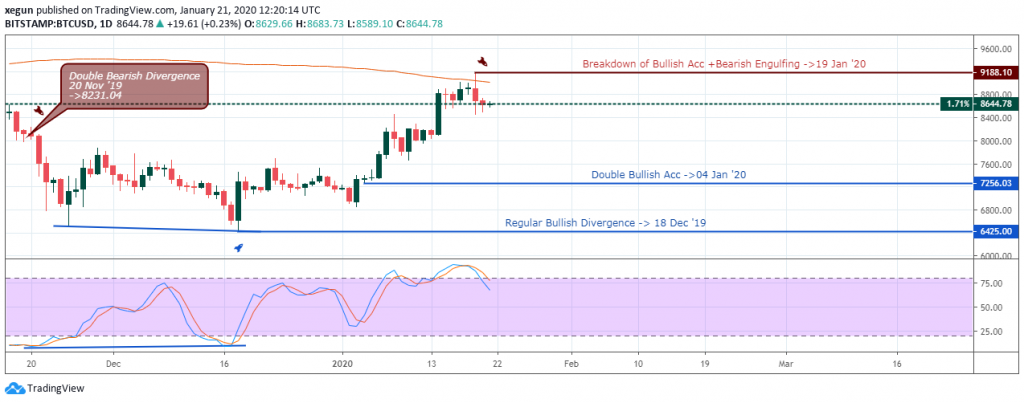
Top Singapore broker terminals, like other global crypto exchanges, reveal a slowing of the BTC price on their trading terminals.
The above daily chart points to the 200-MA as a primary culprit responsible for the price slowing of the number one cryptocurrency. Subsequently, a failure of bullish support $8798.90 on Jan 19 ’20 further emphasize a potential price correction, while leaving the overbought zone.
Perhaps a view from the H4 time horizon may suggest a return of the bullish momentum.
4Hour Chart
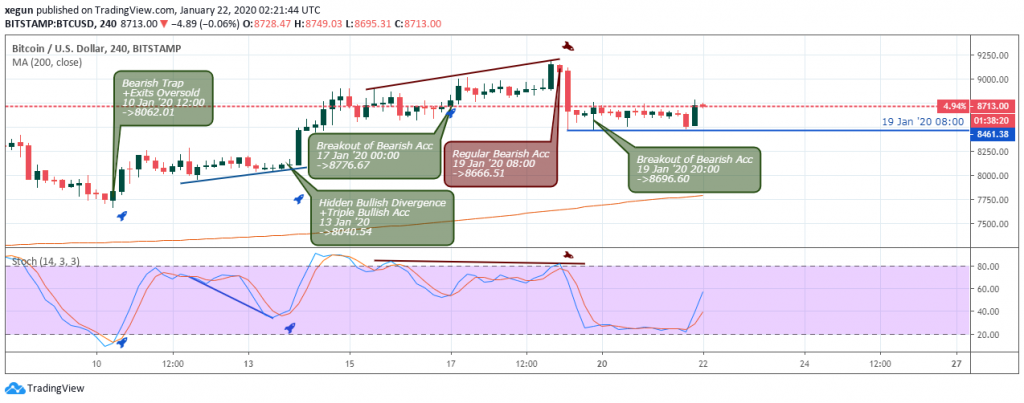
Finishing off on the H4 time frame, a sharp bullish thrust $86896.60 above the $8669.41 resistance may bring the bulls back into the game, and consequently, a breach of the 200-daily MA.
Conversely, a break below the $8461.38 support would indicate a prolonged bearish price correction phase.
The volume of CME Groups’ Bitcoin Options Doubles One Week after Launch
CME Group’s Bitcoin (BTC) options more than doubled its traded volume following its launch one week ago.
As per data released by the company, since it went live on January 13, Bitcoin options volumes skyrocketed.
The records reveal that on the first day of the launch, volume was 55 contracts—equivalent to 275 BTC, which is currently worth $2.37 million. However, by January 17, volume was 122 contracts—worth a whopping 610 BTC ($5.27 million).
On Friday 17, open interest on options according to the data reached 219 contracts—equivalent to 1,095 BTC ($9.45 million).
Conclusion and Projection
Bitcoin bulls earnestly lookout for an eventual breakout of the 200-daily Moving Average for a continuation of the bullish trend.
Chart setups, such as a hidden bullish divergence or the recent split of bullish resistance on the 4hour time frame, may restore the BTC for a price objective of $10350.00, perhaps in the following weeks.

- EURUSDWeekly outlook – 7th January 2022 - January 7, 2022
- BTCUSD – Weekly outlook for Bitcoin Price – 23rd December 2021 - December 24, 2021
- USDSGDWeekly outlook for Singapore Dollar – 17th Dec 2021 - December 17, 2021

