BTCUSD Outlook & Technical Analysis for Bitcoin
Contents
Introduction
The War of Covid-19 vices BTCUSD as revealed on bitcoin sites. The first quarter of 2020 did come with uncertainties and fear due to the outbreak of coronavirus, having a global impact on economies and sectors. It’s a waiting game for brokers.
BTCUSD Technical Analysis
Monthly Chart

Resistance:
The BTCUSD has been creating higher lows on the monthly chart. The all-time high of 01 December 2017 (Resistance) 19666.00 still holds.
After the bulls rally (retracement) bitcoin price met resistance at 13880.00 on 01 June 2019, pushing the price down again. Another resistance was formed at 9219.13 on 01 March 2020 after a slight pullback of price.
Support:
BTCUSD support level has been rising gradually over the months. The bitcoin gained significant-high during 2017 before its pullback in 2018 (3122.28) to establish new support and a bounce around Moving average also confirms another bullish accumulation and rallies up.
01 March 2020, bitcoin price was rejected at 3795.11, and moving average acted as a bounce also.
Weekly Chart

Resistance:
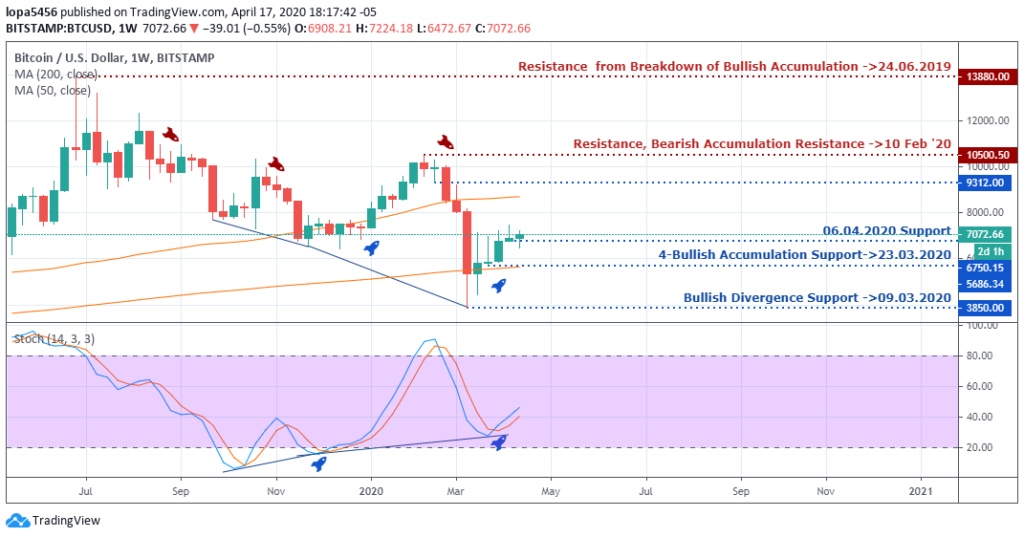
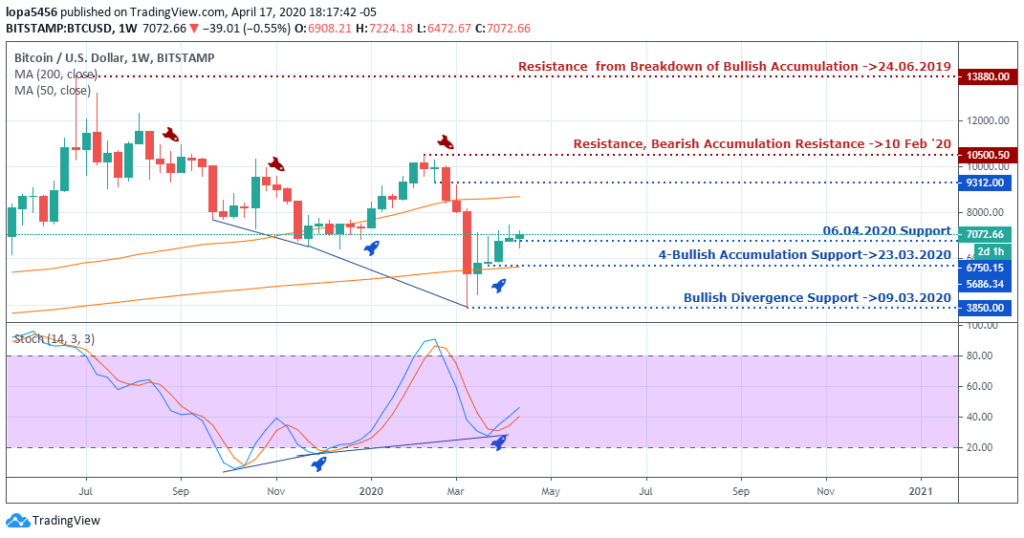
BTCUSD has had a bearish pattern over the weeks. After every correction it drops, taking out the support levels creating a lower low indicating a downtrend for bitcoin. Resistance from the breakdown of bullish accumulation 24 June 2019 set the high of the resistance at 13880.00.
The bearish accumulation resistance of bitcoin price at 10500.50 on 10 February 2020, led to the fall of the price before it found new support.
Support:
The bullish divergence support was confirmed with the stochastic oscillator with rising support. Bitcoin price found another support on the moving average after a rejection of price at the 7000 zones.
Bullish accumulation support was formed on 23 March 2020 at a price 6750.15.
The BTCUSD has been on the rise for the past weeks, currently, it has gone above the 7000 zones, and it has set new support at 7072.66. Traders hope price could surge higher towards the 9000 resistance zone.
Daily Chart

Resistance:
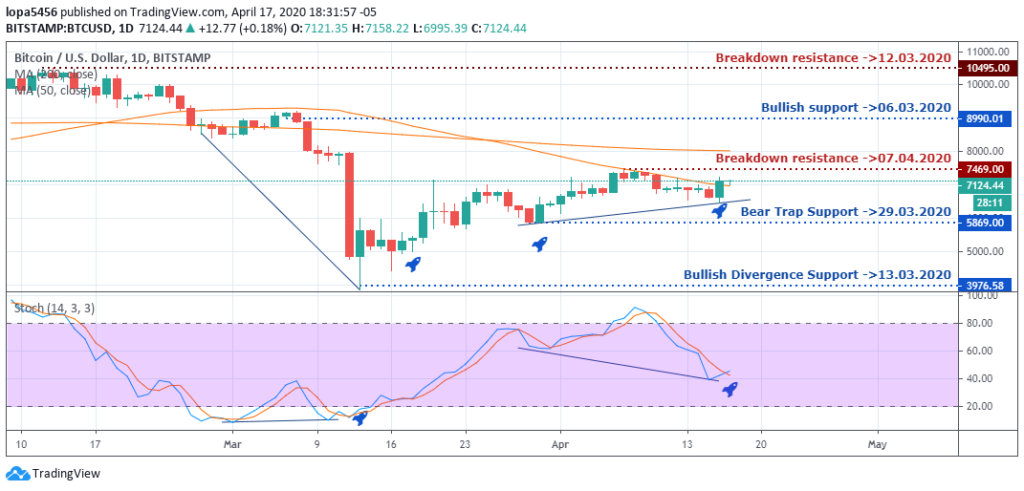
Breakdown resistance on March 12, 2020, held. The market makers of trading institute pushed the price of BTCUSD down for some days, from 104955.00 to 3976.58. The overbought level of the indicator also establishes the shift of momentum to the seller side.
However, after price retraced upwards, it found resistance at 7469.00 on April 07, 2020, and pushed downwards with little momentum.
Support:
The bitcoin price has been on the rise since the bullish divergence support was kept intact after a firm rejection of price at that zone of 3976.58 on 13 March 2020.
The lows are getting higher on the daily charts with a strong bull rally to the upside. Currently, there is a bear trap support from the chart pattern of candlesticks and the stochastic oscillator pattern, also the support level on 29 March 2020, at 5869.00.
H4 Chart

Resistance:
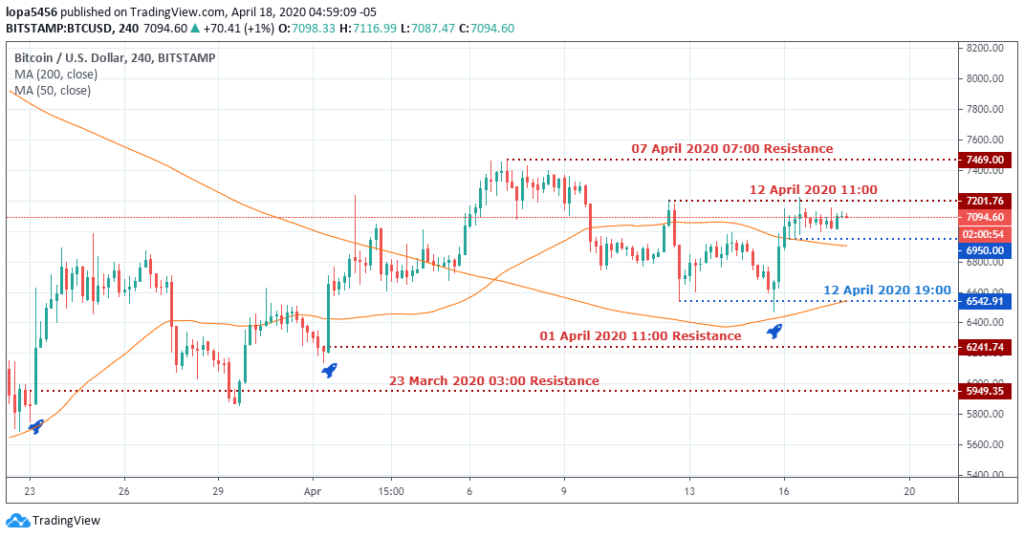
The bears were able to have control of the market after the bulls steam ran out after days of an uptrend. The resistance held 7 April 2020, at 7469.00.
Sellers set another level of resistance on the 12 April 2020 after another correction or pullback of the price at 7201.76.
Brokers are watching the price of bitcoin ranging between 7000 and 7201.76. If BTCUSD should close above 7201.76, it will expose the next resistance level.
Support:
The bitcoin price has been on the rise since the support or low of March 23 2020, at 5949.35. The bullish engulfing candlestick took the price higher, and after the correction, more buyers came into the market to take the price further up from the support zone of 6241.74, on April 01 2020.
After price failed to go higher than the resistance level of 7469.00, the bears took the BTCUSD down to 6542.91 support zone before establishing another support after double bottom chart pattern held. As of April 12 2020, the BTC price rose from 6542.91 to 7094.60.
Bitcoin BTC News: Can The Price of Bitcoin Surge Above $7,000 Mark?
Bitcoin price continues to surge higher after price found its support at $6241.74. brokers and other traders are keenly paying attention to the sentiments going on in the market after the approval of the US senates to provide $2 trillion economic stimulus bill for the purpose of relief to the country’s economy in terms of businesses, financial market, stocks, workforce, health, etc. to revive the system due to the effects of coronavirus pandemic.
The BTCUSD price is in a range between $6500 and $7200 zone. This shows there is indecision in the market. Brokers await strong fundamental news to drive the price to either a bullish trend or a bearish trend.
BULLISH SCENARIO
If the bullish scenario should payout by bitcoin price closing over $6900 mark, it will attract more traders pushing the price for a new target of $8000.
BEARISH SCENARIO
If the stimulus plan does not have any substantial impact and the Covid-19 pandemic is not under control, we can see the bitcoin price respecting that $7000 zone and price dropping down to the previous support of $6542.91 level.
Conclusion and Projection
As at the time this report was done, the price of BTCUSD ranges between 7201.76 (resistance) and 6542.91 (support). Singapore brokers and many retail traders are paying attention to the current market sentiment of BTCUSD to see which direction the price will finally swing to.
The Covid-19 pandemic has led to the lockdown of countries have affected many institutions around the globe, therefore, making the market full of uncertainties.

- EURUSDWeekly outlook – 7th January 2022 - January 7, 2022
- BTCUSD – Weekly outlook for Bitcoin Price – 23rd December 2021 - December 24, 2021
- USDSGDWeekly outlook for Singapore Dollar – 17th Dec 2021 - December 17, 2021

