Bitc0in Price Forecast for Bitcoin
Contents
Introduction
The news from the Chinese authority on their plans to launch their digital currency had a lot of criticism from online Bitcoin brokers and other market participants for their decisions to crack down on cryptocurrency miners.
China’s lawmakers want to have a regulated digital currency even if other countries have open arms for the bitcoin community.
BTCUSD Technical Analysis
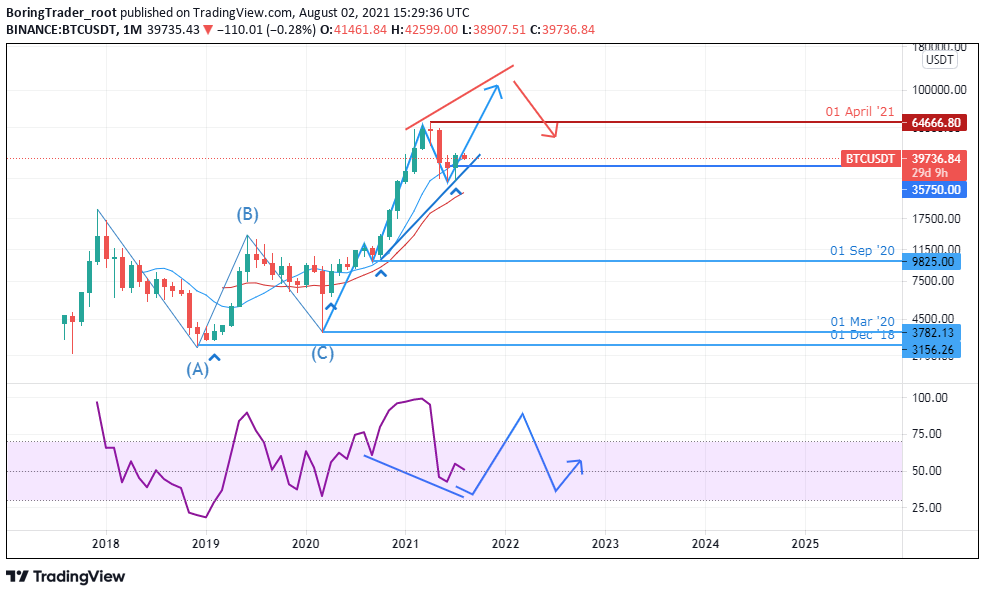
Monthly Resistance Levels: 65000, 59577, 47251, 42652
Monthly Support Levels: 28671, 47251
The BTCUSD pair has been on a bearish trend for the past 3 months since the price fell from the ATH of 65000 levels which saw online brokers who are in a long position take profit at the resistance zones. The short position traders could push the price down to 28671 after breaking lower than the support level of 47251, since taking over the market from the high. If the sellers can close below the 28671 levels, we may see the price drop to the 20000 levels.
A bullish surge may happen from the support zones of 35110 as we saw a bullish close of the July candlestick. If the zone has a solid bullish momentum, we may see the long position traders, online brokers, and Institutional traders come into the market for another bullish run. A close above the 42652 levels (previous support zone acting as resistance 47251) will take the price to the previous high of 650000.
Weekly Chart
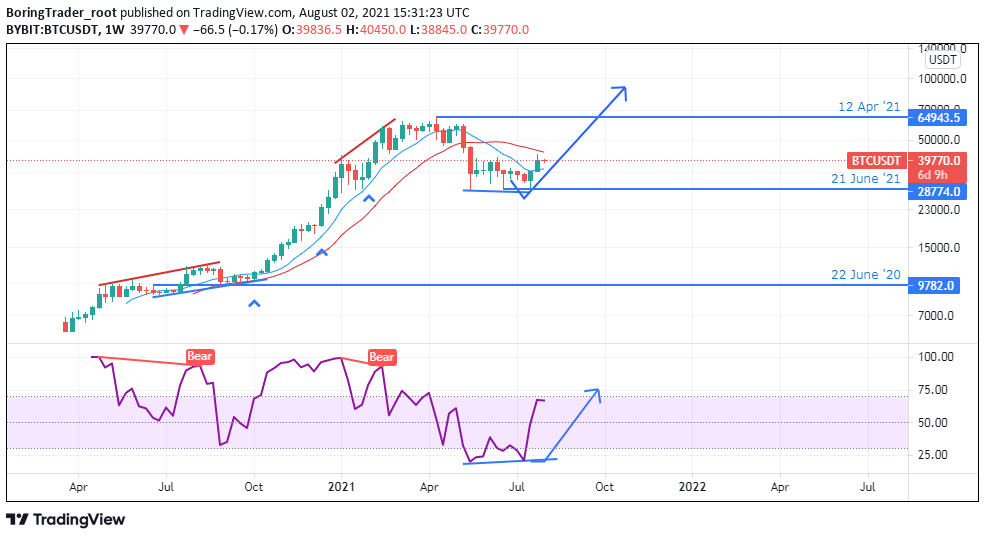
Weekly Resistance Levels: 64943.5, 50000
Weekly Support Levels: 28774.00
Bitcoin has proven to be the one determinant for cryptocurrencies as bigger Institutions like Amazon, pay pal and other international brands are accepting the coin as a means of payment. Some organizations have introduced some tokens to build communities of users.
Could the recent bullish surge be the beginning of another phase of an uptrend?
Market participants will watch the current pullback of price to see if the movement is going to break below the 28603 levels for the downtrend to continue or the bitcoin price will get rejected around the low.
However, if the selling pressure is weak and cannot break below the 36670 zones, we may see the next surge rise from the 36670 regions for a bullish run.
Daily Chart
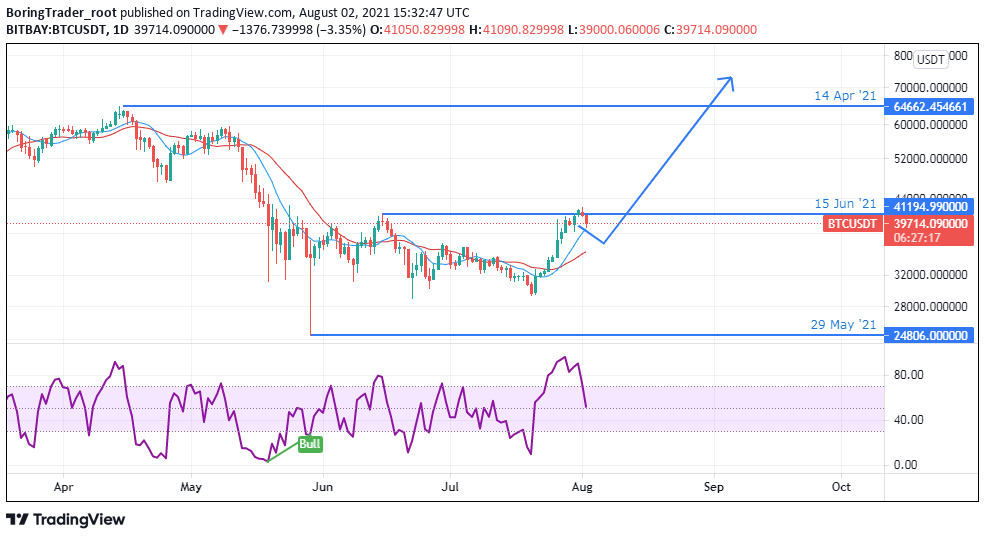
Daily Support 29269, 32000, 24806
The Bulls have enjoyed a bullish run in the last few days of the month of July and the online brokers hope to continue the recent bullish momentum if they can establish support from the 36802 levels for another run. If the Resistance zone of 42614 is taking out, we may see bitcoin go higher to the 46989 zones.
However, if the resistance zones cannot be takeout, we may see the price drops back to the 29269 regions if it breaks lower than the 36802 levels.
H4 Chart
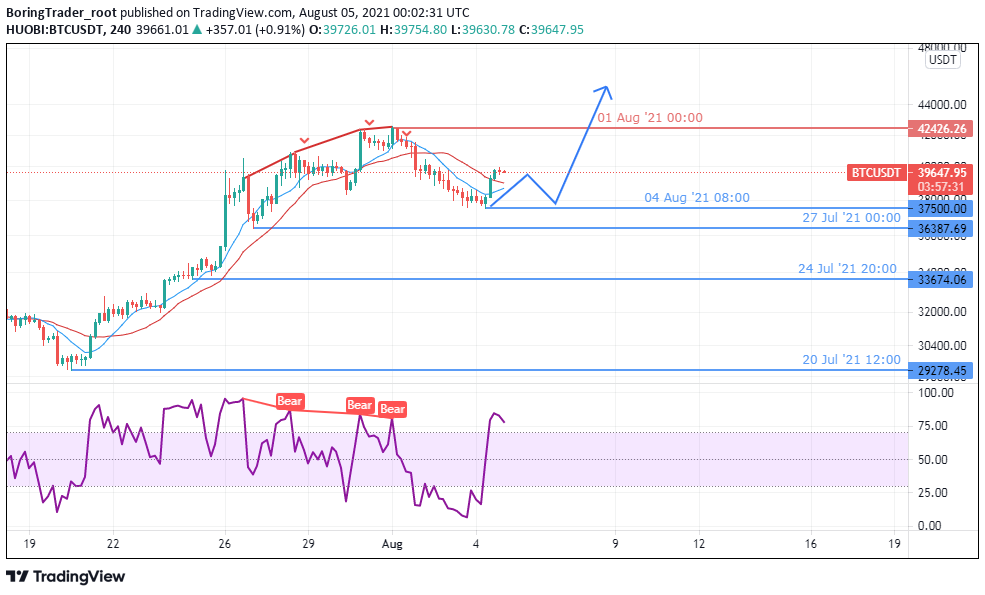
4 Hour Resistance 42673, 42426.26
4Hour Support 37500, 33674.06
The BTCUSD found support and reverse the bearish trend from the 29211-support zone from the 21st July 2021 trading activities before the bullish engulfing candle took out the sellers in the market. The bullish trend has been strong after seeing price breaking above various levels of resistance before hitting the 42673 levels.
At the time of writing this report, we can see the price dropping towards the 38098 levels after hitting the 42673 zones. A close below the current support will expose the 36207-support level. If the bear’s pressure continues, the price may close below the level and dip lower. However, if the seller’s momentum is out, we shall see the bulls push for a breakout above the 42673 resistances and will take the price to a new high after experiencing a downtrend for a while.
Bullish Scenario:
The online brokers finally got their chances to go long after they dominated the support level from the 28671 level. If the current run continues and closes above the resistance level of 42673, we shall see the price rise to another zone on the H4 time frame.
Bearish Scenario:
The BTCUSD pair has hit a resistance zone (42652) on the H4 chart which was previously a support level. If the bitcoin price cannot close above the level, we expect the price to reverse and to drop lower to the support level of 29839 or lower.
Bitcoin BTC News Events
THE CHINESE MISTAKE!
The decision of China to crack down on miners and exchangers has profited other countries like the USA, South America, and some other parts of Asia. Some counties, like Indians and Nigerians, repelled against their governments when they announced all exchangers should close their services as they attempt to ban cryptocurrencies. However, with time the market players in China will fight back as the introduction of digital currency hits the rooftop.
According to the CEO of Applied Blockchain, Wes Cummins, “that the company needs to position itself for quick reaction and capturing of opportunities”. He stated that now is the most profitable time for mining an opportunity China may have lost forever. The Dallas-based crypto mining firm has invested over $32 million into the market since it took advantage of the situation to profit from mining.
BTCUSD Conclusion and Projection
From the look of things, we have seen that the buyers have gained momentum from the current level of support and if the surge can breakout above the 46989 resistances, we shall see the price of bitcoin rises. However, if the price should fail to takeout the
46989 levels we shall see the price of BTCUSD drop back towards the 36670 on the weekly time frame.

- EURUSDWeekly outlook – 7th January 2022 - January 7, 2022
- BTCUSD – Weekly outlook for Bitcoin Price – 23rd December 2021 - December 24, 2021
- USDSGDWeekly outlook for Singapore Dollar – 17th Dec 2021 - December 17, 2021
Tagged with: btcusd


