BTCUSD Forecast for BTC
Contents
Introduction
The cryptocurrency market is about to experience another correction on the monthly chart as online brokers such as OlympTrade will take profits while long position traders are holding on to the long-term bullish projection of the BTCUSD reaching the $100000 mark.
Let’s dive into the charts for more insights.
BTCUSD Technical Analysis
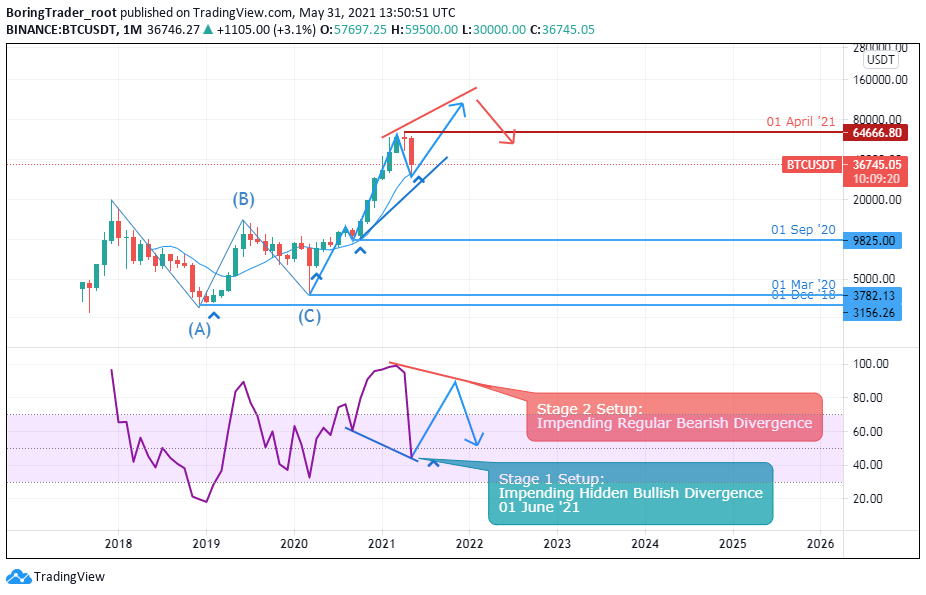
Monthly Chart
Monthly Resistance Levels: 65000, 75000
Monthly Support Levels: 35000, 30000
Bitcoin has made history to become the most sorted coin among others and the demand has been on the increase despite the recent drop in the market. The sellers have dominated the market and we able to close the month on a bearish note.
If the Bears trend is strong, we may see the price close further below the 30000 levels. The BTCUSD is presently on support and we may see the price go up in the beginning of the new month.
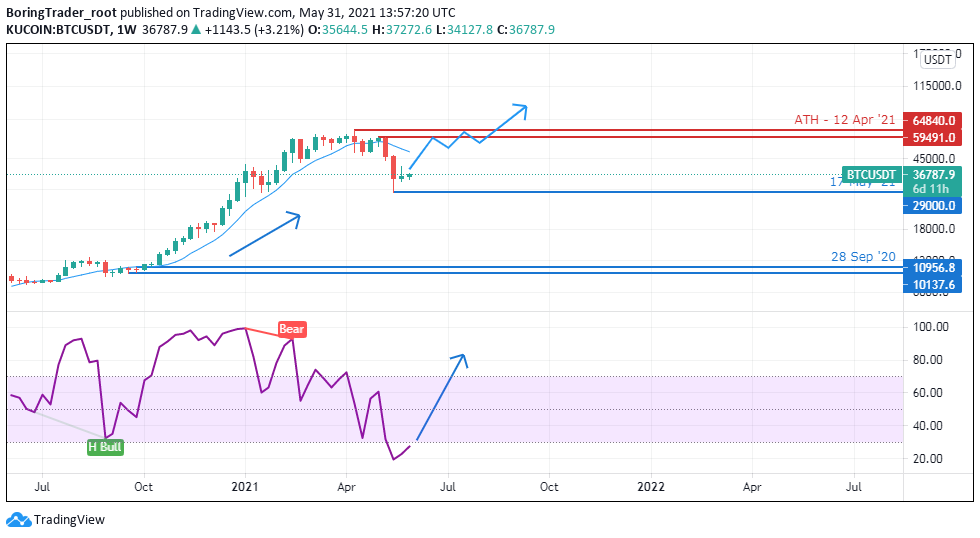
Weekly Chart
Weekly Resistance Levels: 65000
Weekly Support Levels: 35000, 30001
The previous weeks have been a daring week for the bears as they forcefully took the price down due to some events that affected miners in China and other regulatory issues.
We are likely to see the bitcoin make some retracement after the fall that happened two weeks ago from the resistance levels of 65000. If the retracement is weak, we may see another bearish fall breaking out below the present support of 30001.
However, If the bullish surge is strong, we may see it retest the resistance zone for a breakout above to continue the uptrend or to be rejected.
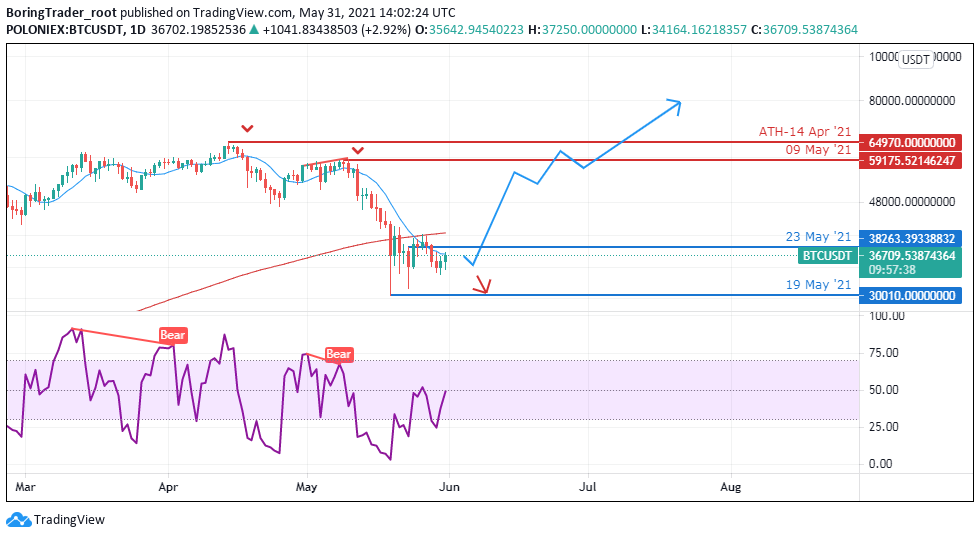
Daily Chart
Daily Resistance 64970, 59175
Daily Support 30010
The daily chart is showing a bullish setup from the support level of 30010. If the institutional interest is in that zone, we will see bitcoin rise in value towards the resistance level of 64970 its ATH.
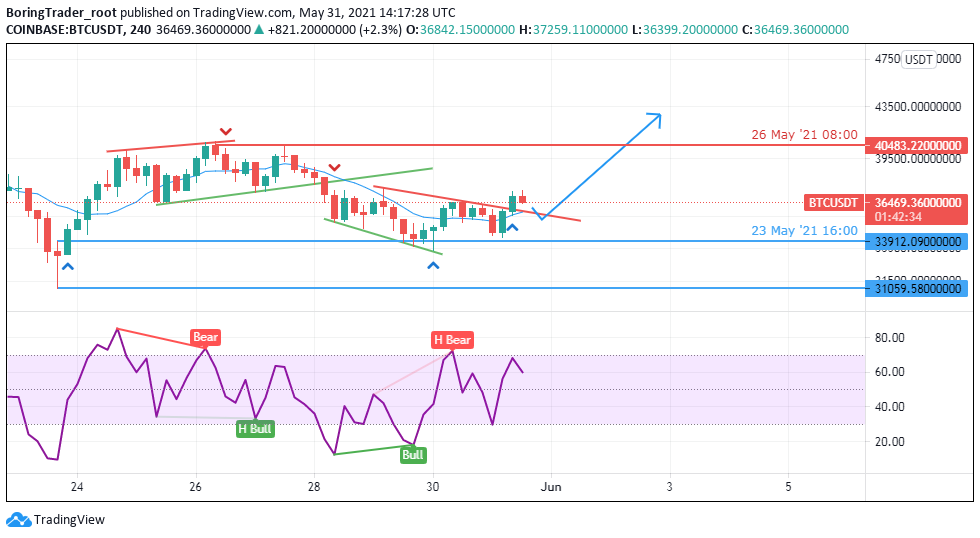
H4 Chart
4 Hour Resistance 403483
4Hour Support 31059, 33912
The Bears still have some levels of dominance on the 4-hour chart as the Bulls are yet to have the grip of the market on the time frame. If the bears can close below the 31059 support, we shall see the price drops lower.
However, the Bull’s momentum can push the price above the 403483 level we shall see more participants open a long position for another bullish run.
Bullish Scenario:
If the Bulls can dominate the zone on the daily chart, we may see bitcoin flying high soon for another bullish rally from the low of its recent fall.
Bearish Scenario:
Looking at the 4hour time frame we can still see that the market participants are still bearish on BTC/USD on the time frame for another push back towards the support of 30010.
Bitcoin BTC News Events
BTC is still the most sorted cryptocurrency on the market despite the upcoming of other coins in the marketplace. The recent drop of bitcoin price and other cryptos has affected the transaction fee to drop to a six-month low according to BitInfocharts. The transaction fee for bitcoin dropped below $7 while that of ETH dropped below $7.30 as well.
Miners are paid with the fees for the processing on the blockchain, the fee is high during heavy traffic and low when the network is quiet also when the crypto price goes up it rises and falls when it drops: at this point, miners are not interested in processing transaction whenever the prices are down.
Conclusion and Projection
The BTC/USD remains the store of value for most institutions and online brokers because of the security and immutability the coin has displayed in recent times.
We are currently seeing the BTC enter a correction phase of the bullish trend it has enjoyed throughout the pandemic period.

- EURUSDWeekly outlook – 7th January 2022 - January 7, 2022
- BTCUSD – Weekly outlook for Bitcoin Price – 23rd December 2021 - December 24, 2021
- USDSGDWeekly outlook for Singapore Dollar – 17th Dec 2021 - December 17, 2021


