BTCUSD Forecast for BTC
Contents
Introduction
Bitcoin sets the pace as one of the best-performing assets in the Q1 of 2021, and it has performed better than Gold, Stocks, and other assets. Crypto brokers will be paying more attention to the crypto-asset in terms of investments and trading.
Now, let’s dive into the technical charts while also looking into some news events in the crypto space.
BTCUSD Technical Analysis
Monthly Chart
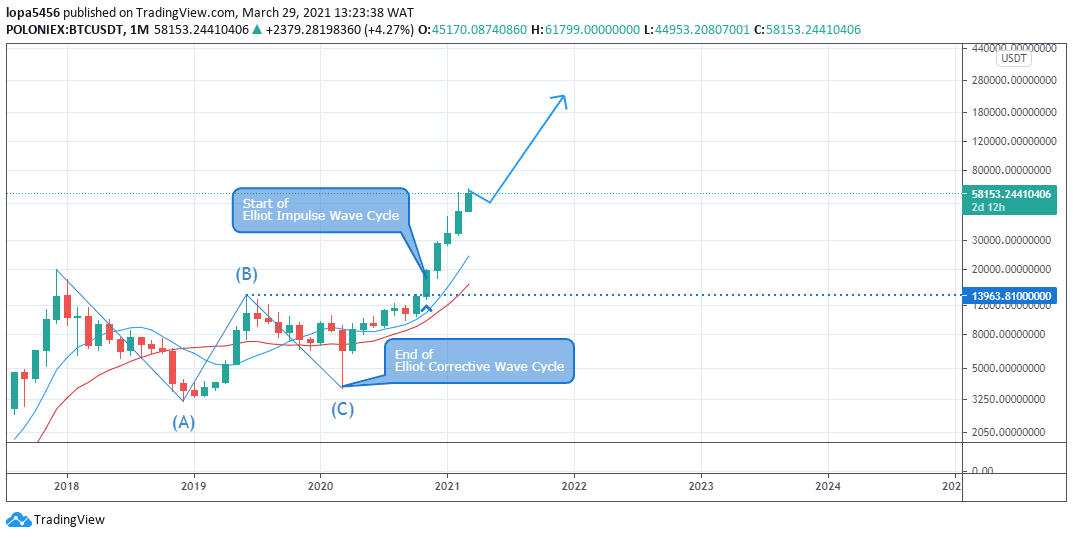
Monthly Resistance levels: 61 000.00, 80 000.00, 100 000.00
Monthly Support Levels: 30 000.00, 45 000.00
The BTCUSD is retesting the new high it created in March (61799.00) for a possibility to break out above it for another swing to the upside for it to continue its bullish run. The bitcoin price has been surging higher as more institutions are now using crypto services for their transactions.
Bitcoin is seen as the most valuable asset among others and beats them in terms of performance, and its growth was over 113% in Q1 2021 while that of Gold declined by 10%.
Weekly Chart
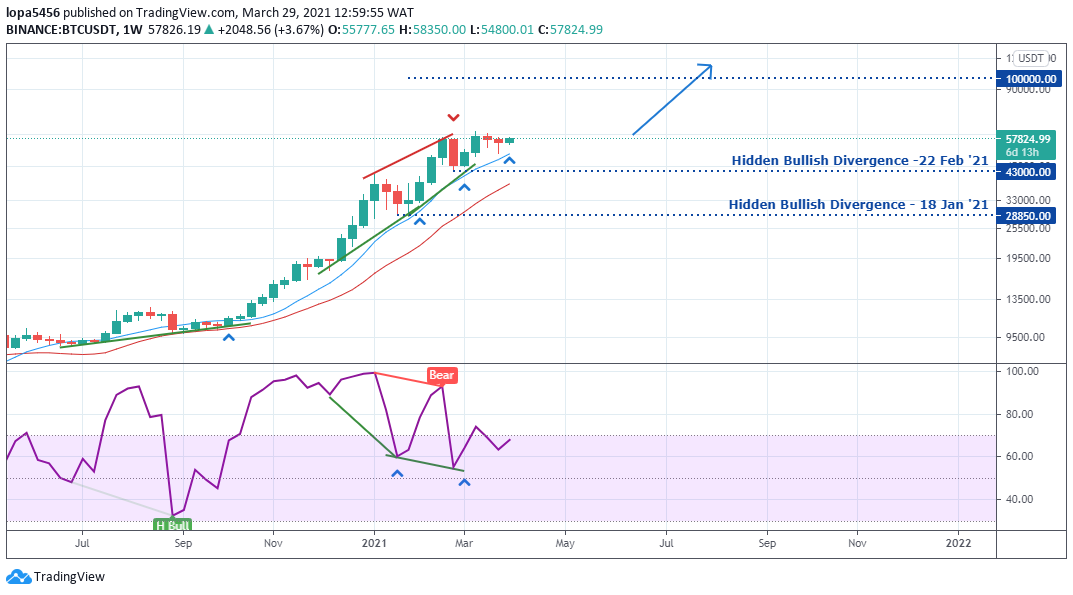
Weekly Resistance 61000.00
Weekly Support 43000.00
The weekly chart shows that the BTCUSD is trying to establish a resistance level at the 58000.00 levels as we can see that the price once dropped from that zone. As the Q1 of 2021 comes to an end this week, we can say that the bitcoin market has been profitable for online brokers.
As the Q2 begins, we may see bitcoin’s price rise above the recent new high it created for another swing towards the 100000.00-dollar mark. If the bullish trend should purse, we may see the price drop down to the low of 43000.00 or lower to 30000.00 should the correction becomes massive.
Daily Chart
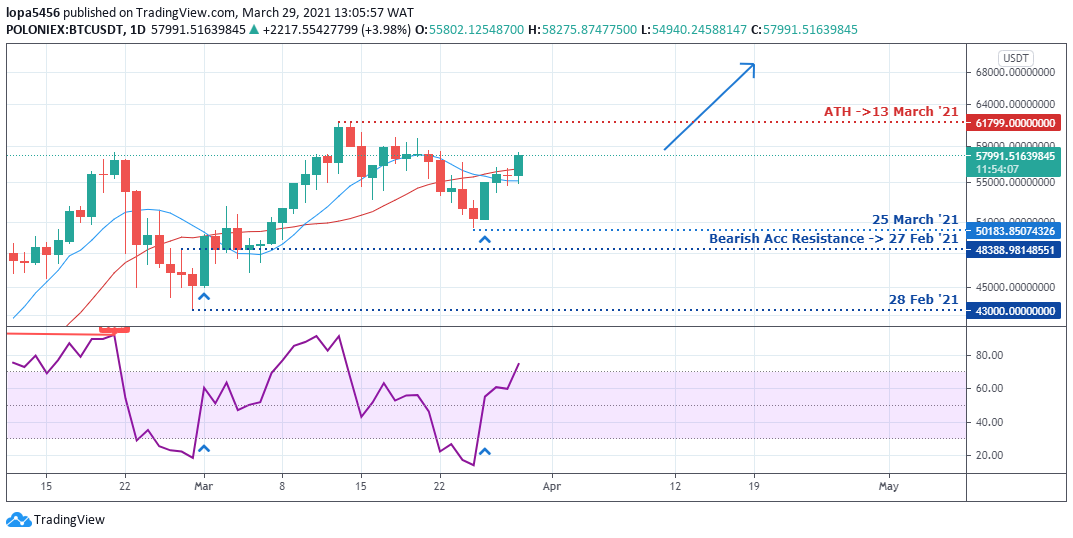
Daily Resistance 61799.00
Daily Support 50183.00
The recent bullish surge in the market from the support zone of 50183.00 shows buyers are pushing for a breakout above the resistance level of 61799.00 to create a new high. It will mean that the bullish trend will continue for days attracting more people and institutions.
The above indicator shows that bitcoin’s price is approaching an overbought region. We might see some investors pulling out their profit from those zones if we observe the price drops around the levels respecting the resistance zones.
H4 Chart
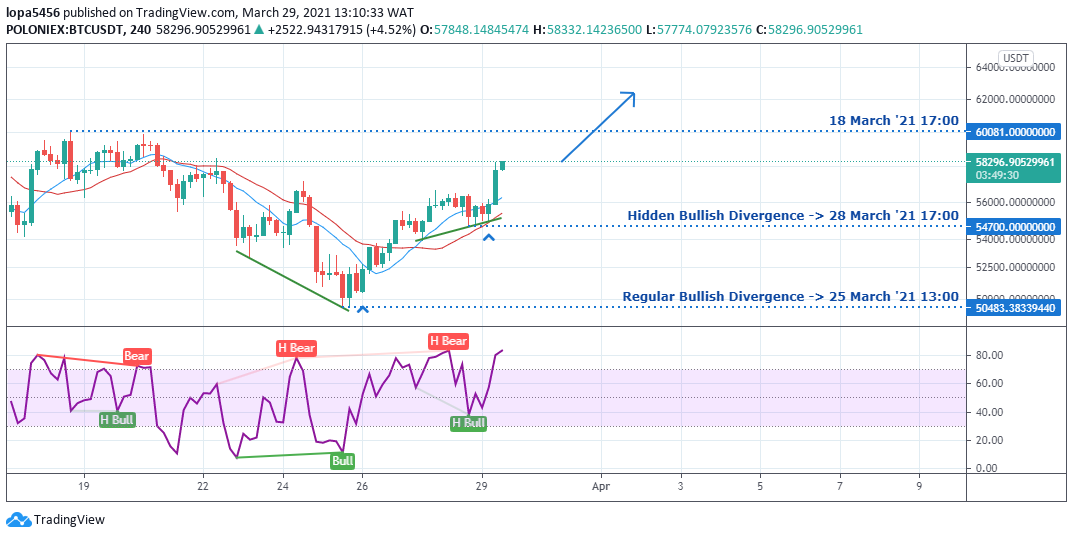
Hour 4 Resistance level 60081.00
Hour 4 Support level 54700.00
You can see that the regular divergence of March 25, 2021, took the price of bitcoin high as the bulls took over the market from the 50483.00 level. Another hidden bullish divergence played out as the bull’s rally is currently running above the 54700.00 level to reach the 60081.00 it went previously. A close above will take the price higher, while a rejection around the zone may push back bitcoin’s price.
Bullish Scenario:
BTC bullish presence is on the rise as we can see that the BTC/USD is surging higher on the daily time frame, and if the bulls can push the price above the daily resistance (61799), we shall see another significant swing high of the bitcoin price.
Bearish Scenario:
The only way we might see a bearish scenario is the rejection of bitcoin price at the 61799.00 resistance level with a significant drop in price from the daily chart.
Bitcoin BTC News Events
In this first quarter of the year 2021, Bitcoin has made over 113% gain more any other asset in the cryptocurrency, stocks, Gold, among others during the writing of this report.
The BTC/USD value has attracted interest from various institutions; for example, PayPal Holdings PYPL launches a platform (Checkout with Crypto Service) for US users to use their cryptocurrency holding to make payment online with merchants worldwide. These will also add to the global acceptance of digital tokens on Main Street and Wall Street.
Bitcoin’s recent success story, the business newsletter’s market section, the Morning Brew, has replaced the price of Gold with that of bitcoin on its website as they hope to serve their readers with quality information on the business finance and investing stories.
Conclusion and Projection
For the past months, we have seen bitcoin’s price creating a new high and testing it before closing above the high. As the Q1 comes to an end this week may see buyers trying to use the thin liquidity to push the price higher, setting a new ATH.
The bitcoin price may continue to be on the rise if it can close above the recent high it has established in March 2021.

- EURUSDWeekly outlook – 7th January 2022 - January 7, 2022
- BTCUSD – Weekly outlook for Bitcoin Price – 23rd December 2021 - December 24, 2021
- USDSGDWeekly outlook for Singapore Dollar – 17th Dec 2021 - December 17, 2021


