Bitcoin to USD – Weekly Technical Analysis for Bitcoin Brokers
Contents
Introduction
Bitcoin price further plummets towards the $4000.00 mark as bitcoin brokers and speculators have a negative bias towards bitcoin fundamental events and technical bearish patterns that support them.
Fundamentals
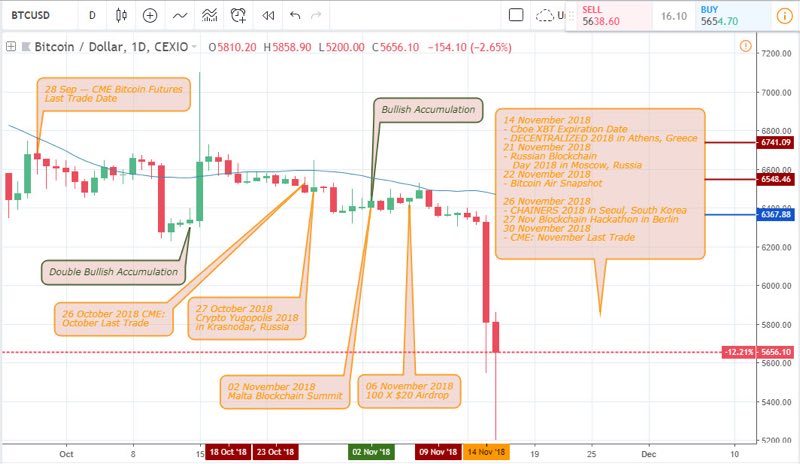
Let us do a recap of previous events from a daily chart time frame.
Review of Past and Upcoming Events in the Bitcoin Community

27 October 2018 Crypto Yugopolis 2018 in Krasnodar, Russia
Starting from the Yugopolis event in Krasnodar-Russia, the price chart demonstrated a bullish price spike forming a bullish closing bar with a long upper wick. This event took place after a bearish breakdown of bullish accumulation, indicating an increase in sell pressure.
02 November 2018 Malta Blockchain Summit
The blockchain summit date closed by forming a double bullish accumulation pattern which later failed to another bearish breakdown on November 8.
14 November 2018 – Cboe XBT Expiration Date and
The expiration date of the Cboe XBT leads to huge sell pressure of the BTCUSD pair.
Still making reference to the above daily chart, the 15th, 16th, and 17th days of November ushered in a triple bearish accumulation pattern, that forced the price chart to further plummet by 23.47% as against a 6.04% risk as shown on the image below.
Upcoming Events
November 21, 2018: Russian Blockchain Day in Moscow
Today the 21st day of November is Russian Blockchain day in Moscow. Following the huge price drop, we intend to use this event as a profit-taking trigger as we look out for a further shorting opportunity on the lower 4HR and 2HR timeframes.
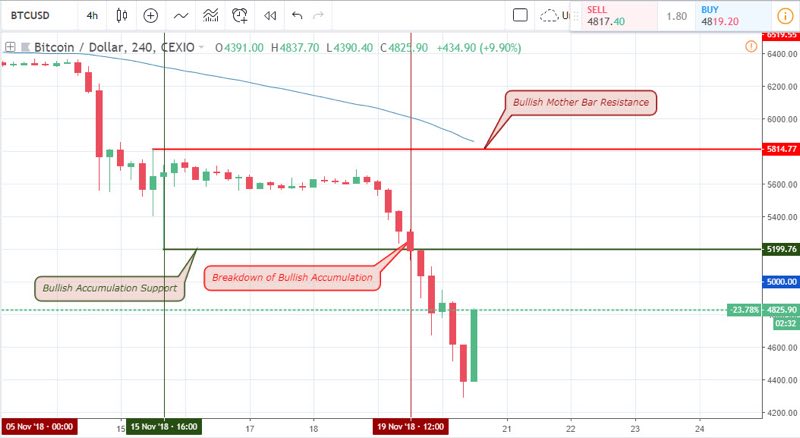
Below are 4HR and 2HR charts of the Bitcoin to USD chart illustrating possible long buying opportunity and exit of short-sell trade.
4-HR Chart of the BTC/USD

The above chart shows an illustration of a price breakdown of a channel formed by a bullish accumulation pattern on November 19. From the breakdown point, price continued for another 16.85%. An update to the above chart shows the percentage drop as well as a new bullish accumulation pattern formed at the 4th hour of November 21.
2-HR Chart of the BTC/USD Pair
The 2-hour chart supports the bearish breakdown as it triggers a bearish hidden divergence pattern on November 18, coupled with a bearish accumulation pattern. Moving forward, price continued to trigger a series of bearish accumulation patterns indicating consecutive bearish closing candles.
Towards the end of the trend, a brought of a bearish accumulation pattern was triggered, announcing an end to the current bearish trend and a possible long entry and profit taking for the short trade.
November 22, 2018: Bitcoin Air Snapshot
This event will allow Bitcoin and Peercoin holders benefit from coin airdrops. With the bullish accumulation pattern formed on the 4HR and 2HR chart, we anticipate a short-term bullish price recovery towards the upside.
Following this price drop, other upcoming events are as follows:
– 26th November 2018 – CHAINERS 2018, in Seoul, South Korea
– 27th November 2018 – Blockchain Hackathon in Berlin
– 30th November 2018 – CME Last Trade date.
Conclusion and Projection
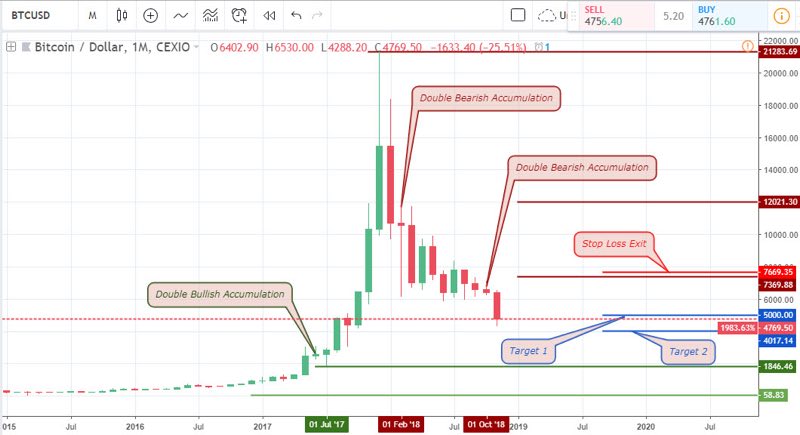
As the above upcoming event dates unfold, we’ll be looking out for price action patterns that support the current bullish accumulation pattern or breakdown patterns that indicate a continuation of the long-term bearish trend triggered by the double bearish trend of the monthly chart shown below.
Monthly Chart of the BTC/USD Pair

As crypto brokers and speculators enter short sell positions forcing the price to plummet from a monthly time horizon. From the monthly chart shown above our first profit target of $5000.00 is hit. We expect the price to attain our second profit target of $4017 by the end of the month or into the new month as upcoming events may be interpreted as further bearish sentiments by speculators.
By month end, we look forward to exiting all sell trades as we approach the end of CME last trade date on 30th November.
Our Recommended Bitcoin Brokers to trade BTC to USD
Best Regulated Broker: IQ Option

IQ Option is the world’s leading EU regulated financial broker based with a revolutionary platform for all traders. Very popular for crypto trading. Read IQ Option review
- Best Trading App for Binary Options
- Minimum Deposit of only $10
- Minimum Trade of $1
- Trusted Broker
- $10,000 Virtual Funds ( Demo Account )
- Quick Withdrawals
- Outstanding Platform
- Weekly Tournaments
- Gain up to 98%*
Best Binary Options Broker: Olymp Trade

Olymp Trade is an award winning binary options broker with an excellent trading platform support and education tools. Read Olymp Trade Review
- Risk-Free Trades
- Minimum Deposit of only $10
- Max. 90% Payout
- $10,000 Free Demo account
- Free TrainingEducation : 18 Indicators, 7 strategies and 28 webinars 25% Deposit s
- Certified Platform
- Quick withdrawals
Best Binary Bonus: Binomo

Binomo is a regulated binary broker with a wide range of assets to trade and amazing promotions ( bonus, tournaments prizes,..) .Read Binomo Review
- 25% Deposit Bonus ( 100% Bonus VIP accounts )
- Minimum Deposit of only $10
- Minimum Trade of $1
- Max. 95% Payout
- $1,000 Virtual Funds ( Demo Account )
- Weekend trading
- Free training
DISCLAIMER

- EURUSDWeekly outlook – 7th January 2022 - January 7, 2022
- BTCUSD – Weekly outlook for Bitcoin Price – 23rd December 2021 - December 24, 2021
- USDSGDWeekly outlook for Singapore Dollar – 17th Dec 2021 - December 17, 2021

