BTC/USD Outlook & Technical Analysis for Cryptocurrency
Contents
Introduction
Last month bearish price close established a sound resistance level at $12325.00, a level the bulls will have to violate to advance their campaign for a price hike. This and more technical price levels will be identified alongside BTC/USD chart patterns and events driving the Bitcoin price IQ Option platform.
Bitcoin: In the news
Price of Bitcoin Stable Compared to Pound Sterling Despite Brexit
Bitcoin (BTC) continues to be relatively stable compared with the British pound sterling despite the parliamentary faceoff suffered by Britain.
As per The Independent, amid the country’s political drama and the pound’s tribulations, Bitcoin has witnessed robust and protracted growth.
As at press time, the BTC was trading higher than $10,500 — an 8.36% increase on the week.
Meanwhile, the Pound Sterling at a point yesterday was trading below $1.20. Since 1985, such a level of a drop has not been reported.
BTC/USD Technical Analysis
BTCUSD Long term Projection: Bullish Correction Phase
BTC/USD: Monthly Chart
The bitcoin to dollar exchange rate as illustrated in the above chart is in its first correction phase after coming out of the crypto-winter of 2018. We start to notice an accumulation of sellers which hints a likely deeper price correction should the bulls fail to close the current monthly price above the significant resistance at $12325.00.
BTCUSD: Weekly Chart
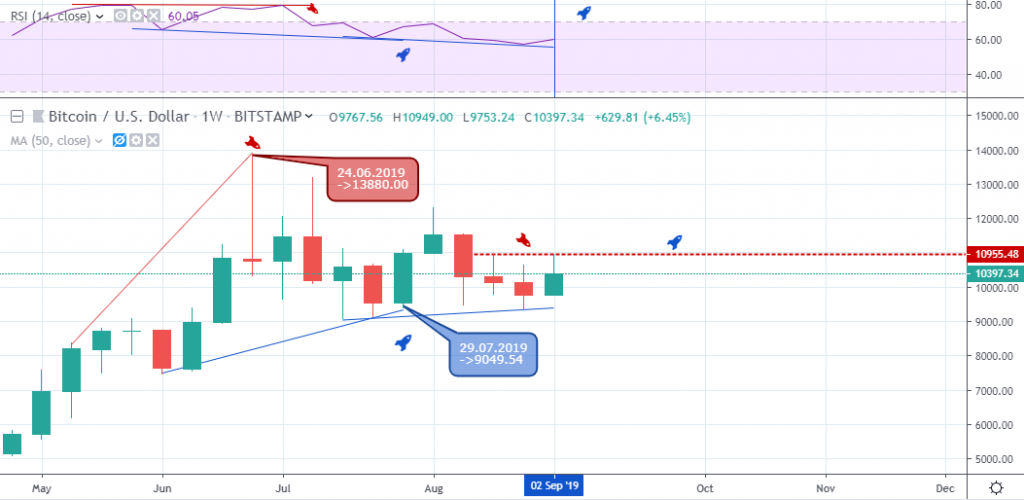
Bullish momentum appears to bear on the decline as the last three weeks close bearish, setting resistance levels at $10955.48 and $10650.00. These resistance levels serve as closer targets for the bulls to attain for further price hike and confirmation of the anticipated hidden bullish divergence.
BTCUSD Medium Term Projections: Bearish
BTCUSD: Daily Chart
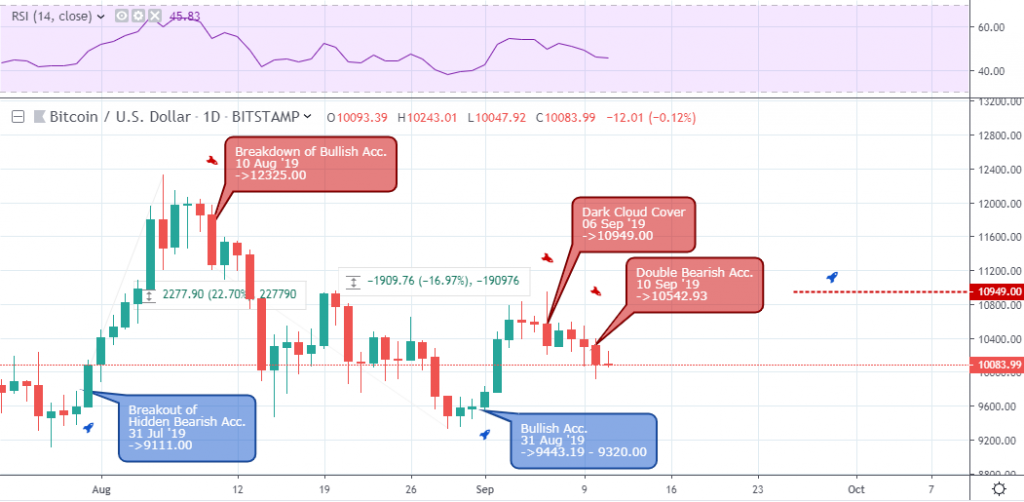
A daily chart overview shows the pair rejecting support levels on August 10 and 28 ’19 as the bears form lower peaks from the local high of $12325.00 to $10955.48, and $10949.00.
The bears are currently in charge of the Bitcoin price direction after signaling a dark cloud cover candlestick pattern on September 06 ’19. The accumulation of bearish resistance at publication time leans towards a possible explosive price move in the bearish or bullish direction. The price will, of course, have to close above the $10542.93 resistance to guarantee an upbeat swing.
BTC/USD: H4 Chart
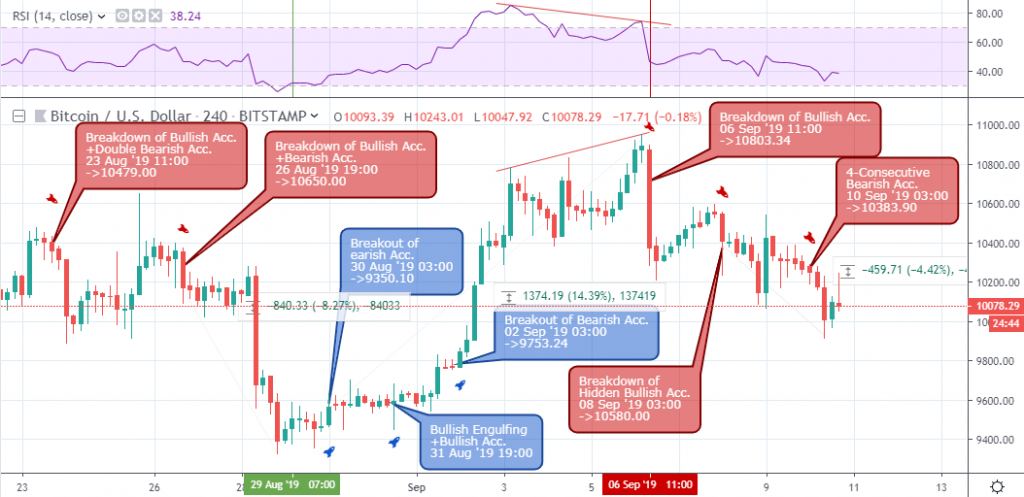
Bullish and bearish swing trading setups are revealed on the 4hour time frame, starting from August 23 11:00, and 19:00 where the bitcoin to dollar rate on top Singapore broker/exchanges slumped by roughly 8.27%.
Opposing breakout of bearish accumulation on August 30 03:00 and 31 19:00 pushed the price higher by about 14.39% prior to the regular bearish divergence on September 06 ‘19 11:00.
The price slump continued at press time as the bears again broke below hidden bullish support on September 08 03:00 (4.42%).
BTC/USD Short Term Projections: Bullish
BTC/USD: H1 Chart
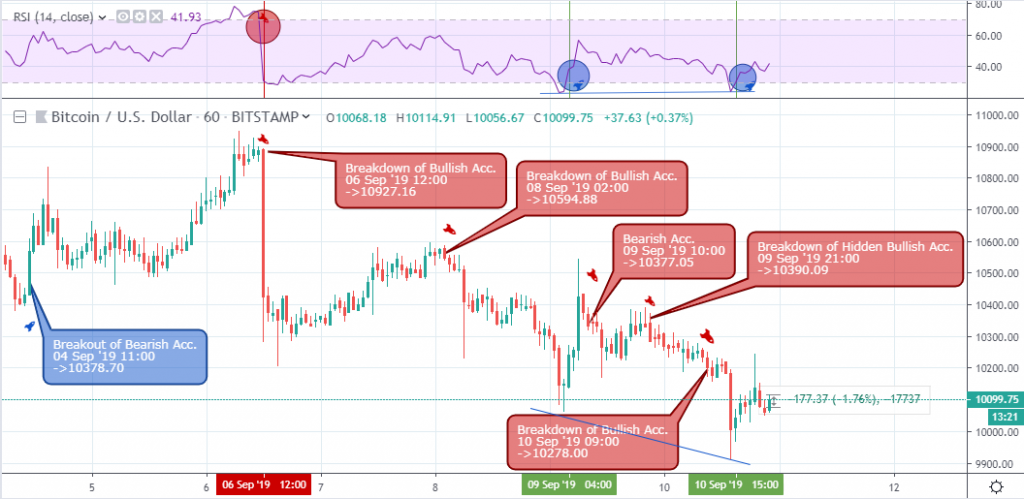
At the intraday level, the Bitcoin price still maintains a stable bearish outlook beginning with an increase in volatility to the downside on September 06 12:00. From the initial price drop, the chart continued to form lower highs on September 08 02:00 and 09 10:00.
The bulls are slowly staging a comeback by flagging regular bullish divergence patterns after coming out of the oversold area on September 10 15:00.
Conclusion and Projection
The BTC/USD is clearly in a correction phase which may likely be prolonged and may result in the Bitcoin price heading towards the $9K round number level if the bears persist. However, an increase in volatility that leads to a breach of the $12325.00 resistance may result in a bullish upbeat in the long term.

- EURUSDWeekly outlook – 7th January 2022 - January 7, 2022
- BTCUSD – Weekly outlook for Bitcoin Price – 23rd December 2021 - December 24, 2021
- USDSGDWeekly outlook for Singapore Dollar – 17th Dec 2021 - December 17, 2021

