BTC/USD Outlook & Technical Analysis for Bitcoin platforms
Contents
Introduction
The price correction in the Bitcoin price persists on OlympTrade platforms as Kevin O’Leary spreads fear uncertainty and doubt in a heated debate with Anthony Pompliano on CNBC published on August 06 ’19.
We move on to analyze significant chart and key events driving the Bitcoin price.
Bitcoin: In the news
The $10,000.00 round-number support holds firm on the BTCUSD chart as investors look forward to 50% expiration of the CME Futures this Friday.
Futures expiration often points to ignite Bitcoin volatility, but different events have historically behaved in different ways.
Also, in the news, Bitcoin volatility drops to its lowest low in eight weeks.
Let’s go ahead and see how the chart patterns interpret these events.
BTCUSD Long term Projection: Bullish and consolidating
BTC/USD – Technical Analysis
BTCUSD: Monthly Chart

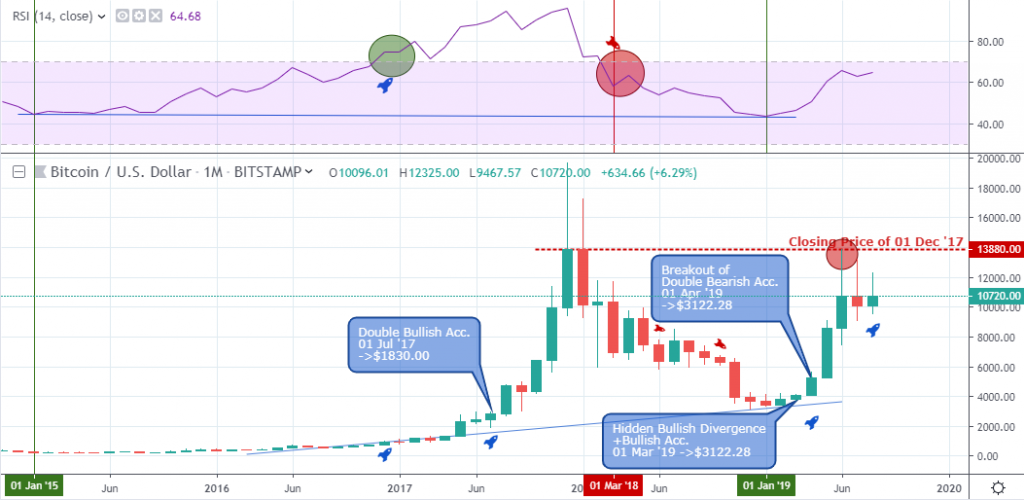
The breakout of collection of bearish resistance levels on April 01 ’19 also confirmed a hidden bullish divergence pattern, confirming a continuation of the long term BTCUSD bullish trend.
Bullish momentum reduced upon hitting last year January 01 ’18 monthly open price at $13880.00, with this year June 01 ’19 high peaking at the same $13880.00 resistance. For a convincing bullish or bearish direction, the Bitcoin price will have to either close above the inside-bar resistance of $13200.00, or beneath the support at $9,049.54.
BTCUSD: Weekly Chart

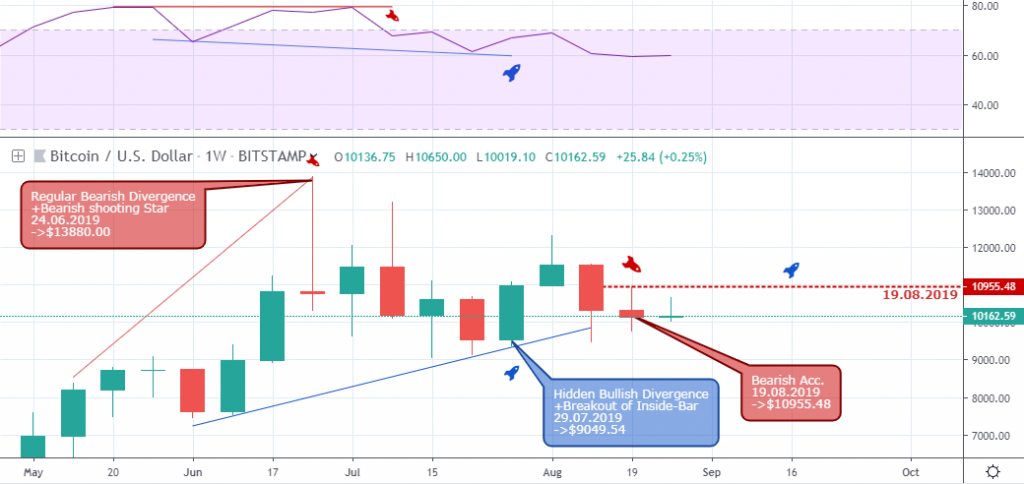
Still trapped within an expanding channel that’s built from opposing bearish and bullish divergence patterns on June 24 and July 29, the bears established a new resistance level at $10955.48. This may be the last attempt by the bears to send the Bitcoin price into a long term downward spiral.
If the bulls succeed in pushing the price above the level, it will confirm an increase in demand, and the BTCUSD could enter the overbought area again.
BTCUSD Medium Term Projections: Bullish
BTCUSD: Daily Chart

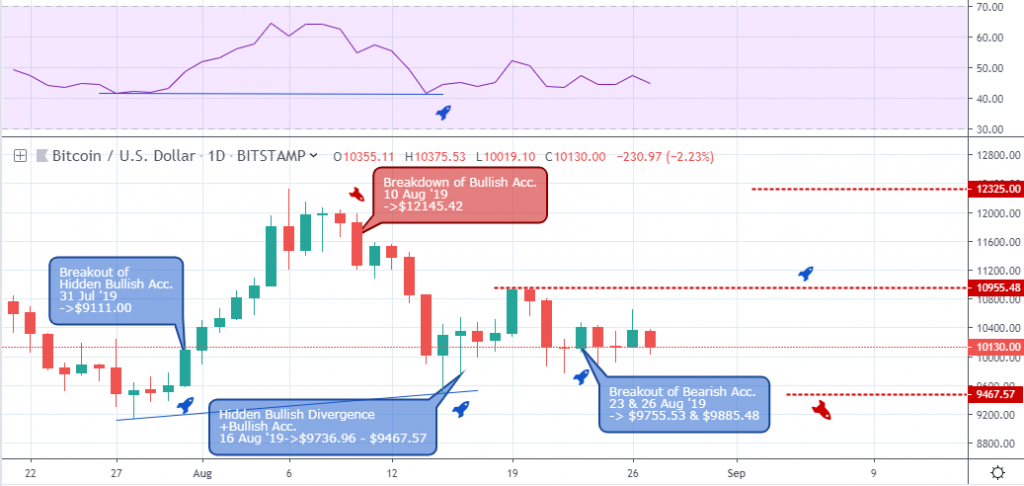
The Bitcoin price descends from a series of bullish closing bars that started from a break of resistance on July 31. Attempts were made to restore the price to its previous highs, and perhaps to a higher price on August 16, 23, and 26 ’19.
The Bitcoin to dollar exchange rate from the daily time frame reveals it maintains a bullish outlook at publication time. However, a price close below the $9467.57 support will confirm an increase in the supply of BTC and possible price decline.
BTCUSD: H4 Chart

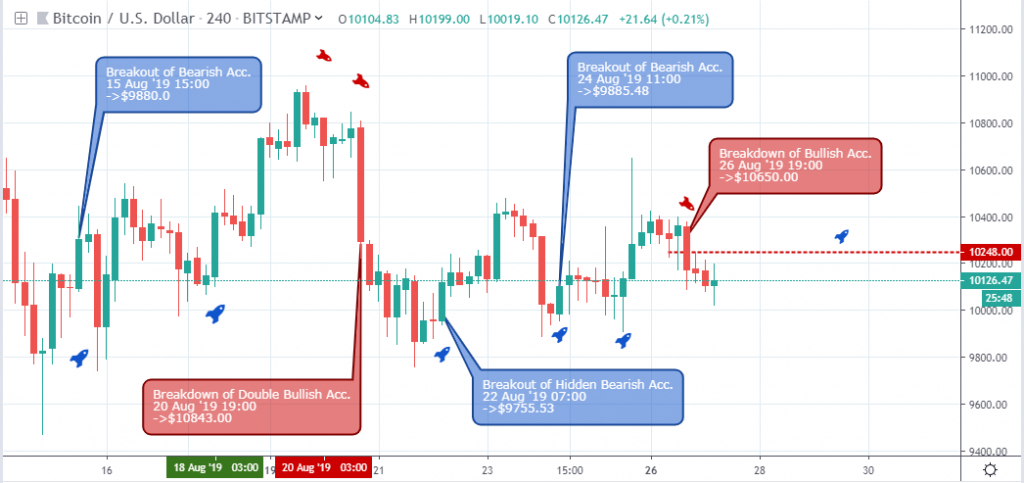
Viewing from the 4hour time frame, the BTCUSD on top Singapore broker platforms establish support at $9467.57, and $9880.00 after a breakout of resistance ($10153.15) on August 15 15:00. The bullish move was cut short following a breakdown of hidden bullish support on August 20 03:00 as the price plummets by roughly 8.7%.
Things are looking up for the bulls as they break new resistance levels ($10074.60, $10031.45, and $10355.89).
BTC/USD Short Term Projections: Bullish
BTCUSD: H1 Chart
Bitcoin BTC price from an intraday 1hour chart perspective maintains a bullish outlook by signaling bullish divergence setups on August 25 18:00, and August 27 00:00.
Bearish momentum could not exceed the Pin-bar support at $10019.10, and the bulls already show a strong comeback at publication time.
Conclusion and Projection
Although the BTC/USD is in its longest correction phase this year, and last year’s resistance at $13880.00 holds the bulls from further advancements, some analyst still view the current correction in gains as a healthy move for further advancements considering that the $9049.54 support level is not yet violated by a price close on the monthly time frame.

- EURUSDWeekly outlook – 7th January 2022 - January 7, 2022
- BTCUSD – Weekly outlook for Bitcoin Price – 23rd December 2021 - December 24, 2021
- USDSGDWeekly outlook for Singapore Dollar – 17th Dec 2021 - December 17, 2021

