USDSGD Technical Analysis for Singapore
Contents
Introduction
There’s so much tension in Asian markets this week following a Reuters report of sanctions on China official by the US, on alleged involvement in Hong Kong.
These investment and many more sends mixed signals into the markets and we may see a strengthening of the Greenback in the coming weeks.
The USDSGD starts slowing after setting a new 2020 low this month as revealed across all top Singapore trading brokers, let’s analyze the charts and consider other important fundamental events/data.
Singapore Fundamentals
Singapore FX Reserves in USD
The Nation of Singapore’s’ FX reserve includes gold, some currencies, and maybe even treasury bills and government/corporate bonds.
The FX reserve indicates the Singapore economy’s health, where a higher value is viewed as positive for the Singapore dollar. Conversely, lesser reading is seen as unfavorable for the Singdollar.
The Singapore FX reserve maintained a bullish trend from 08 May 2020 to date, with readings at 301.8B to 352.6B.
Up to 594 new Covid-19 cases hit South Korea on Tuesday, leading to more than 1.50% slump in the of the nation’s shares. We’ll have to wait and see if there will be a ripple effect towards Singapore.
From the monthly chart of the Singapore 30, the index trades within the ten and twenty moving average, indicating that we should expect a decline in the Singapore economy. We may see a slowing of the USDSGD in the coming weeks.
US Fundamentals
The USD Index slumped by about -8.3% after a breach of the 99.652 support set on 20 April 2020. The index dipped below the stochastic oscillator’s oversold area after failing to close above the 20 weekly moving average.
The US unit labor cost is an important macroeconomic event that gauges the annual labor price changes, except for farming-related businesses.
The actual result came out positive at
-6.6% over the forecast of -8.9%.
USDSGD Technical Analysis
USDSGD Long term Outlook: Bullish
Monthly Chart
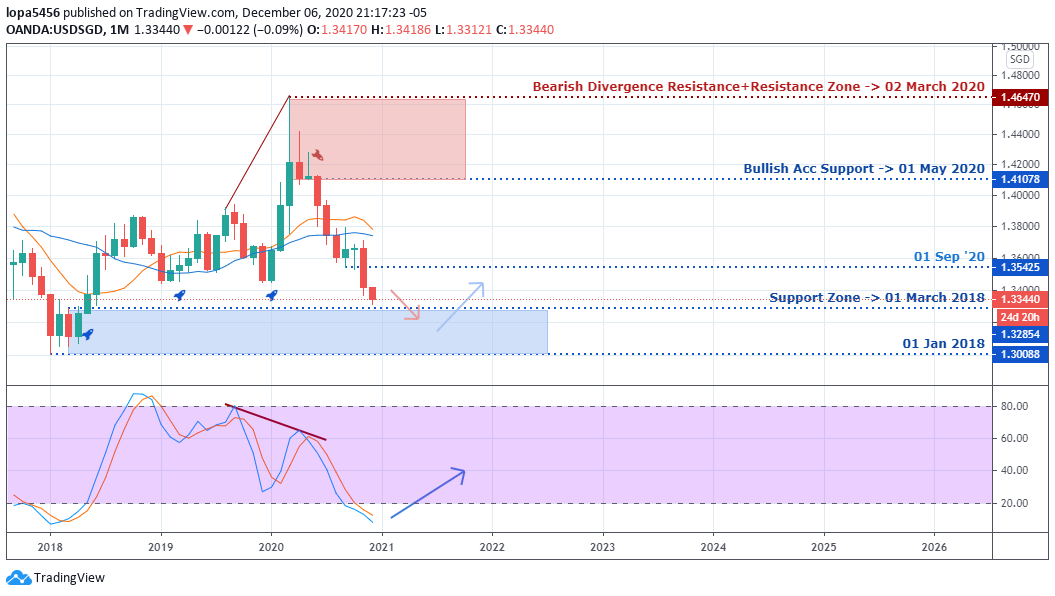
Regular bearish divergence in combination with a collapse of the 1.41078 support illustrated above forced the USDINR foreign exchange rate into the stochastic oversold area.
An exit of the oversold area means we should expect a price recoil to the upside, returning control to the bulls.
Weekly Chart
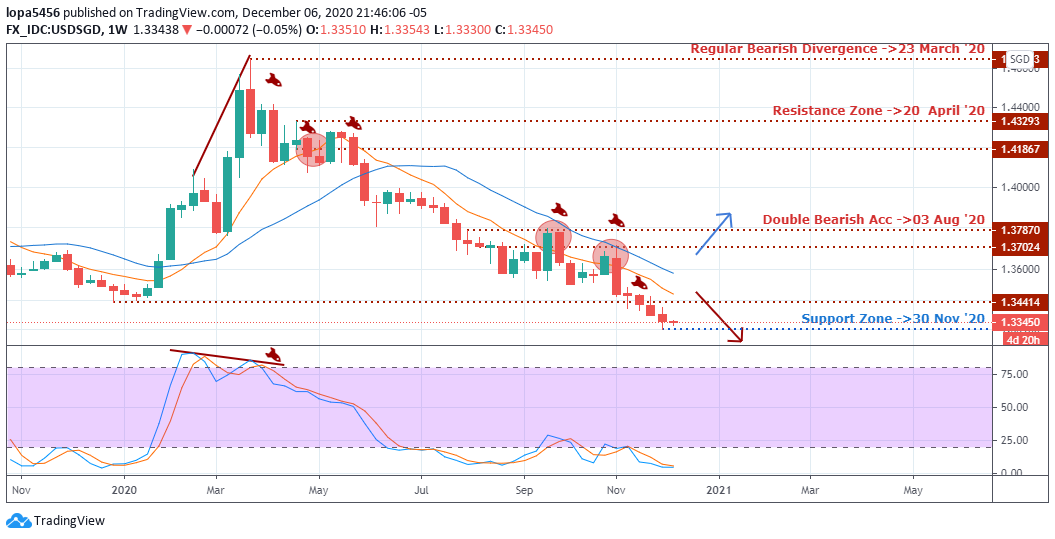
Weekly Resistance Levels: 1.43293, 1.41867, 1.37870,
1.37024, 1.34414
Weekly Support Levels: 1.33121
Backing the monthly chart divergence was a similar bearish divergence at the same peak on 23 March 2020, sending the USDSGD into a bearish spiral by roughly -9.0% from the 23 March high.
Entering and exiting the MA10 and MA20 area, which coincides with the 1.37870 and 1.37024 resistance, triggers a continuation of the bearish trend.
A price breach above the 1.37870 resistance hints a change in trend from bearish to bullish.
USDSGD Medium Term Outlook: Bullish
Daily Chart
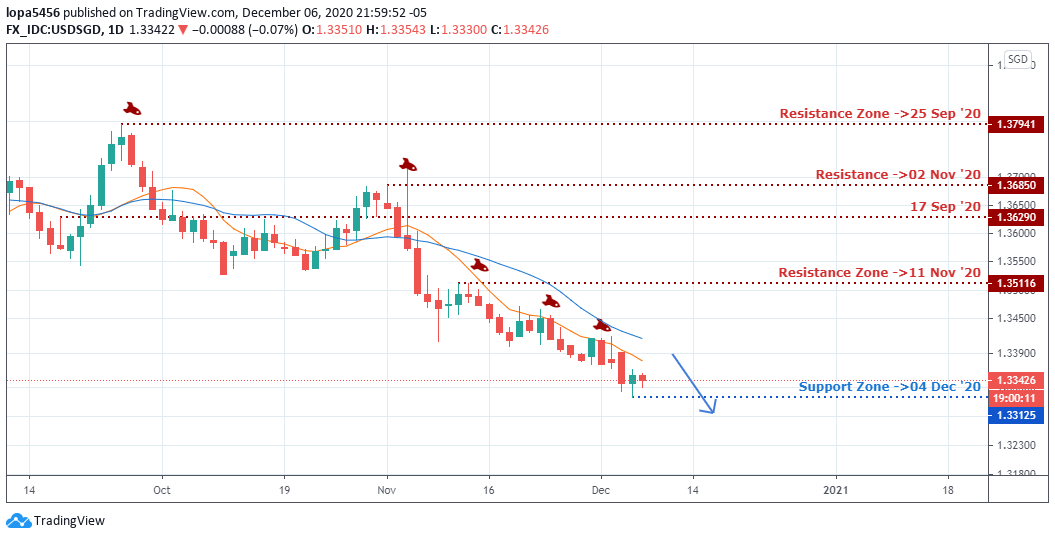
Daily Resistance Levels: 1.3941, 1.36850, 1.36290, 1.35116
Daily Support Levels: 1.33125
H4 Chart
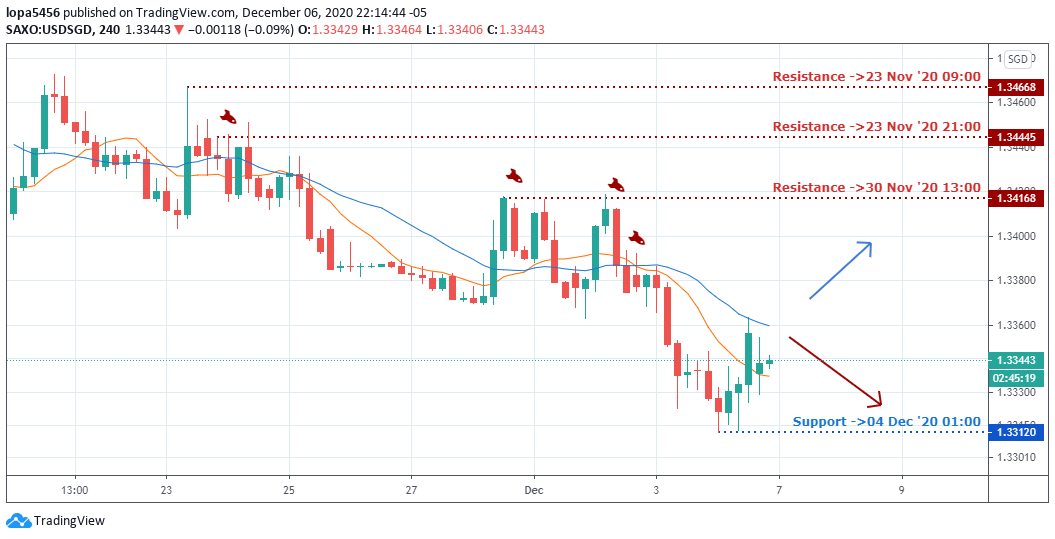
4Hour Resistance Levels: 1.34668, 1.34445, 1.34168
4Hour Support Levels: 1.33120
Analyze the chart Above HERE
Bullish Scenario:
A price close above the 1.35425 resistance would signal a long term long entry since that was where the bulls last gathered on the monthly chart, revealed as a bullish-acc setup.
Bearish Scenario:
Bearish momentum may extend into the 1.32854 and 1.30088 support zone where trades should consider locking in profits from short sell trades.
Conclusion
With new highs formed between the ten and twenty daily moving average, we should expect the bearish trend to persist into the remaining days of the week.
The 1.32854 and 1.30088 support area make sense for locking into taking profits if you are in a short-sell order.

- EURUSDWeekly outlook – 7th January 2022 - January 7, 2022
- BTCUSD – Weekly outlook for Bitcoin Price – 23rd December 2021 - December 24, 2021
- USDSGDWeekly outlook for Singapore Dollar – 17th Dec 2021 - December 17, 2021
Tagged with: usdsgd


