USDSGD Technical Analysis for Singapore binary options
Contents
Introduction
As the US and Singapore economy recovers from the COVID-19 pandemic slowly, fund managers were called upon in the US to value stocks in the market and their performance.
While in Singapore, they are always putting things in place against future outbreaks because of their experiences with the SARS pandemic (2002/03), and Swine Flu (2009).
OlympTrade platform shows the Singdollar making a recovery from the blow dealt by the COVID-19 pandemic. Read on as we move on to analyze the charts and look at some essential fundamental events.
Singapore Fundamentals
The Singapore dollar made significant gains against the US dollar for some days as the governments are doing what it can to stabilize the economy. The recovery process slows the spread of the virus and keeps its daily cases below 50 for two months.
The government intervention in almost all the sector is to stimulate the economy and empower her citizens so that unemployment claims can reduce to the lowest number. The stimulus plan has exceeded 15% of GDP (S$50 billion) drawn from the national reserves.
However, the Singapore economy may be heading towards a recession following a strain from the COVID-19 pandemic. The fear of new cases coming up is also of concern, and the numbers of cases are above 32,000.
The uncertainties in the global economy may trigger the risk of after waves of infections in major economies such as the Eurozone and the US, resulting in further economic disruptions.
U.S. Fundamentals
The US government opened up various businesses and other sectors so that the economy can be blossom again after the COVID-19 pandemic.
As businesses are resuming and activities pick up in the order of supply and demand principles, we expect the workforce to increase.
The unemployment claims data is a suitable tool to tell the state of health in the country. Also, a major consideration for those in charge of the monetary policy since consumer spending information is highly correlated with the labour force.
As the new week begins, we expect to receive information on the numbers of individuals who recently filed for unemployment insurance.
When Actual data is released, and the number is lesser than the Forecast data, it is good for the currency. Should it be more than the Forecast, it will be bad for the currency.
Forecast 1300K and Previous 1542K
USDSGD Price Analysis
USDSGD Long-term Outlook: Bullish
Monthly Chart
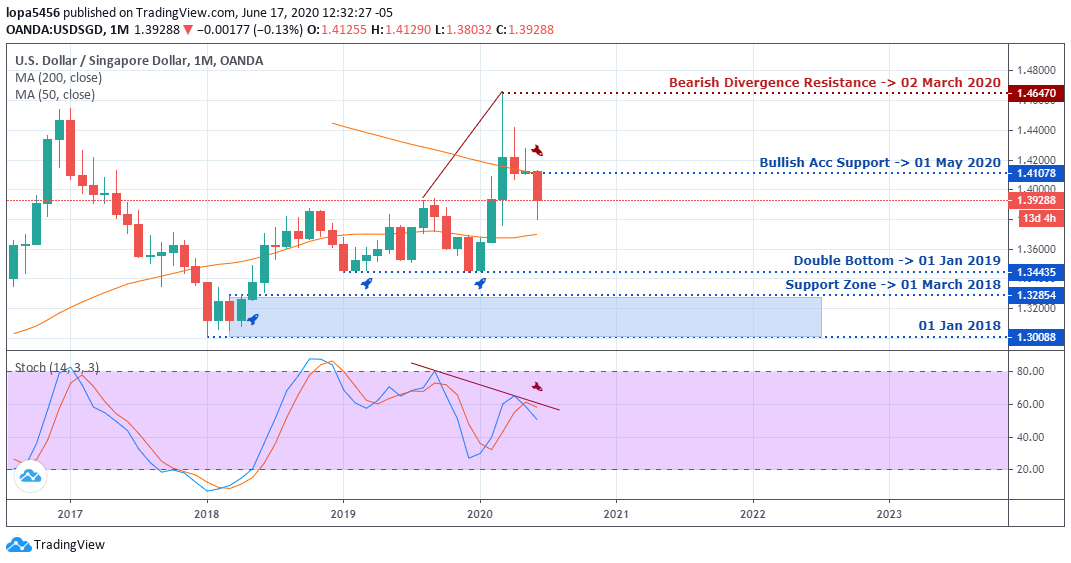
Monthly Resistance Levels: 1.46470
Monthly Support Levels: 1.3008, 1.332654, 1.41078
The USDSGD pair enjoyed a bullish run since 01 January 2019 after the pair established a double bottom on the support zone (1.34415).
A Bearish Divergence build-up can be seen from the resistance zone of USDSGD (1.46470), which is confirmed on the stochastic oscillator.
The bearish trend is more evident since it engulfed the bullish accumulation support candle of 1.41078 of 01 May 2020 taken the price down.
Weekly Chart
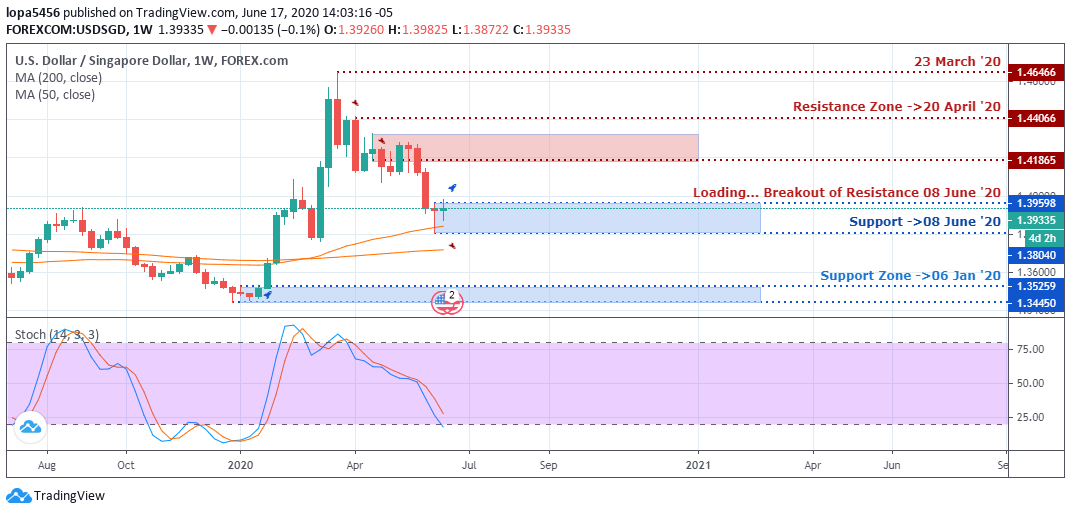
Weekly Resistance Levels: 1.46486, 1.44086, 1.41865
Weekly Support Levels: 1.34450, 1.35259, 1.38040, 1.39588
The weekly time frame shows that the USDSGD is in a corrective stage of the earlier uptrend that started from the support zone of 06 January 2020 to the 23 March 2020 resistance zone (1.46486).
The bearish strength was more prominent after price closed below the 1.41885 prices for some weeks. However, we can see that in the last two weeks of trading activities, the weeks have settled in a Doji candle.
The Doji signifies indecision in the market. The Singapore brokers are mindful of these positions because it shows that sellers are not interested in placing orders around the zone.
From the 1.39330 support zone, there could be an accumulation of contracts for a long position to resume the uptrend.
USDSGD Medium-Term Outlook: Bullish
Daily Chart
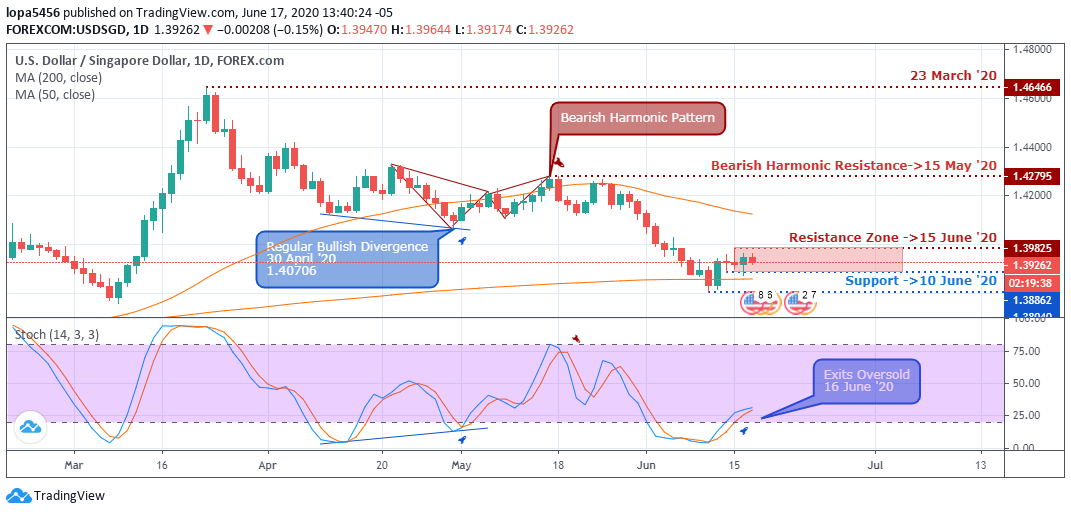
Daily Resistance Levels: 1.48866, 1.42795, 1.78625
Daily Support Levels: 1.38862,
The foreign exchange of the Singapore dollar was best for the past days against the US dollar when the bearish harmonic pattern played out well from the resistance zone of 1.42795 of 15 May 2020.
The USDSGD pair shows some signs of weakness in the trend, and the stochastic indicator is in an oversold zone.
The support of 10 June 2020 is attracting buyers into the market as we can see a Bullish engulfing candle that is pushing the price of USDSGD up gradually.
H4 Chart
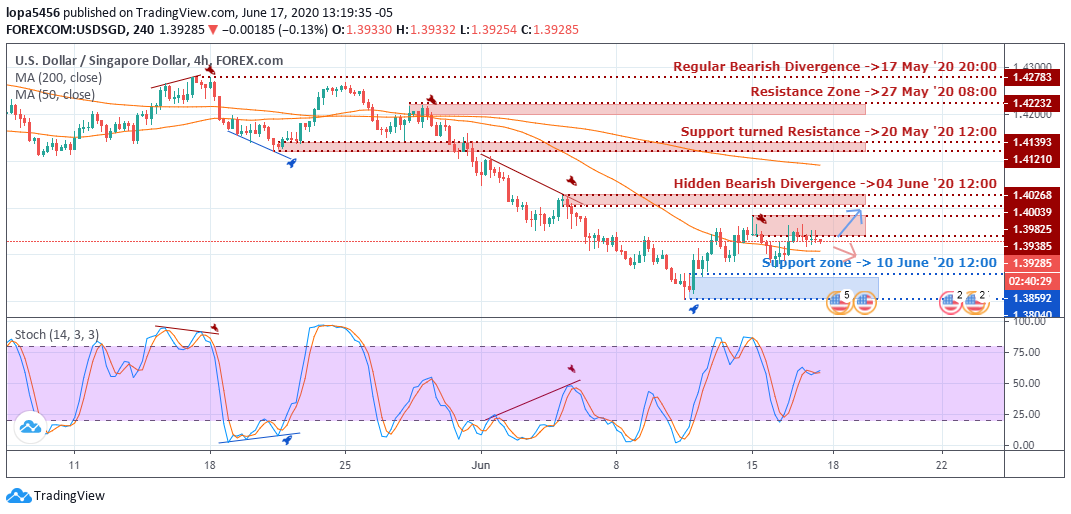
4Hour Resistance Levels: 1.42783, 1.42332, 1.41393, 1.41210, 1.402268, 1.40039,
4Hour Support Levels: 1.35592
The bears took control of the market when the previous support zone of 1.44393 turned to resistance on 20 May 2020, showing a flip in the market direction. Also, a hidden bearish divergence on 04 June 2020 at the resistance zone (1.402668) attracted more sellers.
The support zone of 10 June 2020 (1.35592) pushed back the bear’s pressure after trending for a while. We expect to see the pair go up in the H4 time frame.
Bullish Scenario:
A bullish scenario is building up in the H4 time frame, and we may also see its effects on the daily time frame. The USDSGD pair is possibly ready to continue its overall bullish trend in the coming weeks.
Bearish Scenario:
For weeks the bearish scenario has been in play for correction of the market trend based on the weekly and monthly time frame. In the coming days, we are likely to see a weak seller’s participation in the foreign exchange market.
Conclusion
The USDSGD pair has been on a bullish trend for months before the recent rejection of price to the downside. However, it is expected that the bulls are ready to take over the market in the coming days and weeks.

- EURUSDWeekly outlook – 7th January 2022 - January 7, 2022
- BTCUSD – Weekly outlook for Bitcoin Price – 23rd December 2021 - December 24, 2021
- USDSGDWeekly outlook for Singapore Dollar – 17th Dec 2021 - December 17, 2021


