BTCUSD Outlook & Technical Analysis for Bitcoin
Contents
Introduction
The COVID-19 pandemic is gradually slowing down as we see numbers of fresh cases on the decrease, and the recovery is getting better from different parts of the world.
The governments of various countries are ready to open up her economy to the world to stimulate her economy and businesses. It interests the Singapore brokers to know the status of the one crypto in the market (Bitcoin) and its investment opportunities.
BTCUSD Technical Analysis
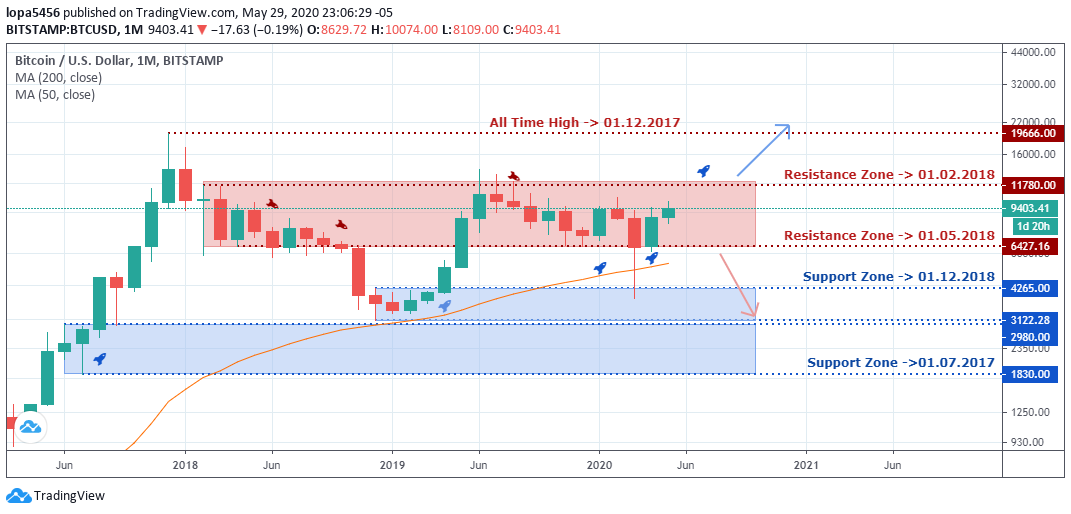
Monthly Chart
Monthly Resistance Levels: 19666.00, 13880.00, 11780.00, 6427.16
Monthly Support Levels: 3172.28, 4265.00, 4265.00
The BTCUSD has shown some remarkable growth after the halving. The growth of bitcoin from the 6427.16 previous resistance zone turned support is about 51.21%.
However, should the momentum continue, the buyers will be breaking through the 117780.00 resistance zone pushing the price of bitcoin.
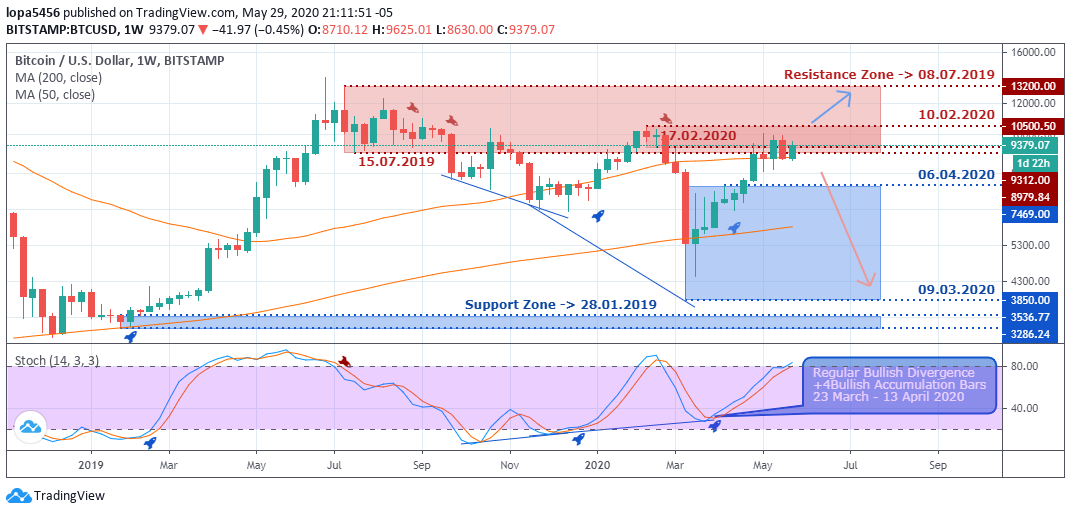
Weekly Chart
Weekly Resistance Levels: 13200.00, 10000.00,
Weekly Support Levels: 3286.24, 3556.77, 3850.00, 9312.00
From the weekly time frame chart, we see that the regular bullish divergence and the four bullish accumulation bars from 23rd March to 13th April 2020 have put bitcoin in an uptrend. We can also confirm this with the stochastic indicator.
However, the resistance zone of (10000) BTCUSD which held on 7.02.2020 (with bearish accumulation pattern), which took bitcoin down with a loss of (-64.59%) from the resistance to the support zone is it under treat again.
The question now is, can they will sustain the movement of bitcoin at this level to break and close above the 10000 mark? The next move of bitcoin will be of interest for the Singapore brokers.
A close above the resistance level of 10,000 will expose the next resistance level of 13,200, an increase of 46.12% to bitcoin. However, should the bulls fail, brokers may see the bears take down the bitcoin price to the support level of (3850.00) 09.03.2020 that would be a (-58%.12) loss to the bitcoin price
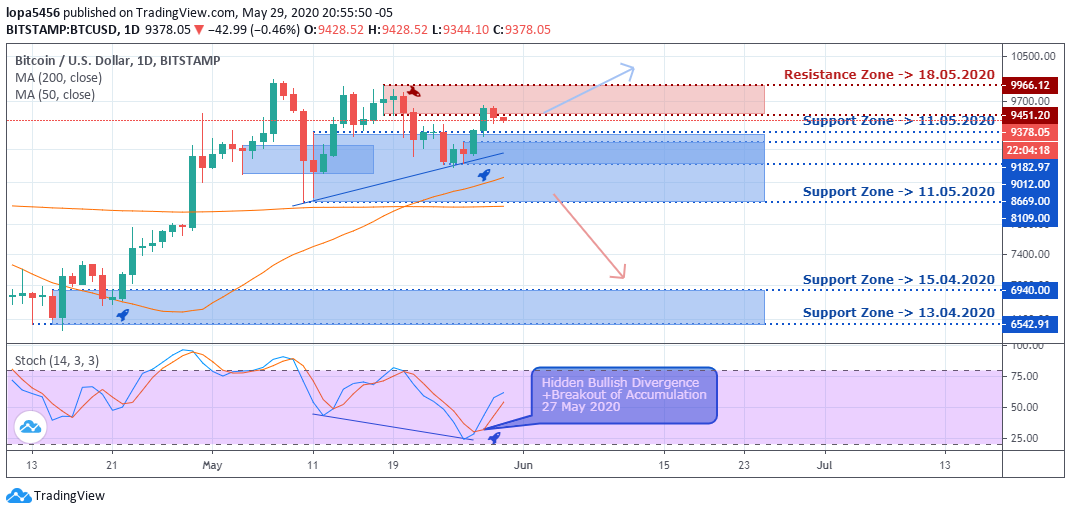
Daily Chart
Daily Resistance Levels: 9966.12, 9451.30,
Daily Support Levels: 6542.91, 6890.00, 8669.00, 9182.97
We have a hidden bullish divergence to support the bulls rally to the upside from the trend line connection of the two supports levels 8669.00 and 9182.97, respectively, with a confirmation seen on the stochastic with a hidden bullish Divergence breakout of accumulation on 27th May 2020. This led to the BTCUSD price increase for some days in the market.
From the Resistance level of 9966.12 is a powerful level for the bulls, if they cannot close above the level we are likely to see a reversal of trend back to the previous support level of 8669.00.
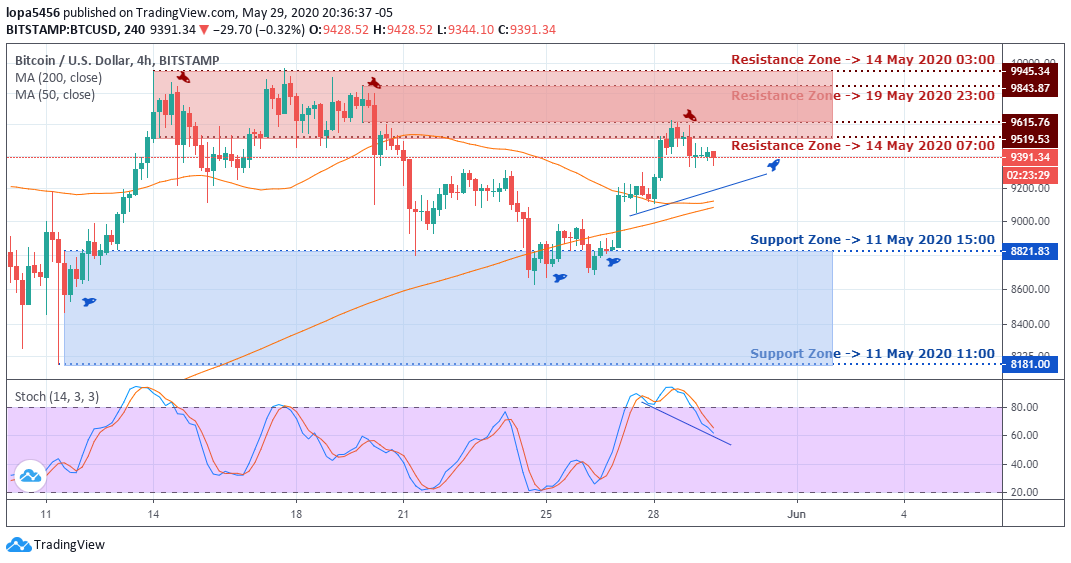
H4 Chart
H4 Resistance Levels: 9945.34, 9843.87, 9615.76, 9519.53
H4 Support Levels: 8181.00, 8821.83, 8628.62
The bullish bitcoin run gained 9.32% in its recent uptrend towards the 9600.00 price level from the 8628.62 and 8821.83 support level before it lost its momentum.
If the bearish accumulation pattern is valid, we shall see a reversal of the trend in the coming days because, for the past 36 hours, the bulls have lost the steam, and there had been a rejection of price at the current level of BTCUSD. Also, the stochastic is in the overbought zone, a sign of a possible downward movement.
Bullish Scenario:
A bullish scenario is still at play based on the Daily and Weekly time frames, but the momentum is getting weak at the smaller time frame like the H4. This might be a correction on the bulls´ side before we get another impulse move again.
Bearish Scenario:
Bitcoin is facing strong resistance to all the time frames; this will probably bring a bearish bias in the coming days and weeks. In this market, nothing is certain we may see the coming week changing the whole analysis. Therefore, the Singapore brokers should trade with caution in the following week.
Bitcoin BTC News Events
Some traders, investors, and brokers saw bitcoin as a safe-haven in this COVID-19 pandemic, and it could provide the best solution to drive a new economy in the post-COVID-19 world. However, the effect of the pandemic was evident in all the cryptocurrencies.
The recent upsurge of bitcoin was due to the monthly close CME futures markets, which happened on 28th May 2020. The open interest of BTCUSD contracts increased by 74% on the active long position above those with short active contracts position held by traders on futures exchanges.
From other reports gotten, the Bitmex and OKEx have $1.6 billion worth of bitcoin futures contracts that were open, and bitcoin increased from $500million to $800 million (60%). All these led to the market volume to drop while the bitcoin futures of open interest rose.
Conclusion and Projection
The upsurge of bitcoin to the high of 9600 can be a false move if the bulls cannot sustain the momentum. However, bitcoin resistance at that level came with force pushing the BTCUSD down after getting to the 9600 levels.
In the coming days, if the bullish bias fails, we may see a shift to the bearish bias should the bears take over.
During this recent COVID-19 pandemic, we can see a correlation between the traditional public market and crypto hedge funds and how they both responded to the volatility in the market. We can see that the crypto assets benefited more in this crisis because more investors bought bitcoin while other currencies lost value. We, therefore, lean towards a bullish direction on the BTCUSD.

- EURUSDWeekly outlook – 7th January 2022 - January 7, 2022
- BTCUSD – Weekly outlook for Bitcoin Price – 23rd December 2021 - December 24, 2021
- USDSGDWeekly outlook for Singapore Dollar – 17th Dec 2021 - December 17, 2021


