USDSGD Technical Analysis for Singapore Brokers
Contents
Introduction
After setting a new all-time high for 2020, the USDSGD started a correction of gains on IQ Option Singapore terminal. This correction is, however, considered a short-term event as we expect a continuation of the bullish swing.
In this post, we’ll uncover the basic price levels and chart patterns responsible for the bullish trend, and not forgetting some macroeconomic events taking effect this week.
Singapore Consumer Price Index (CPI)
The Consumer Price Index (CPI), which is one of the significant indicators of evaluating change in inflation and purchasing sentiment is an indicator that measures the difference in the price of goods and services from the consumer’s perspective.
A lower than expected data reading is considered a bearish move for the currency, whereas a higher than expected reading is seen as a positive move for the currency.
Traders can anticipate a bullish sentiment for the SGD as the most recent data released February 24 shows that the forecast reading is 0.9% while the actual and previous readings are 0.8%.
U.S. ISM Non-Manufacturing Purchasing Managers Index (PMI)
The ISM Non-Manufacturing PMI index calculates the overall economic health of the non-manufacturing sector.
The compound index is determined by the diffusion indexes of indices with similar weights. These indicators make up New Orders, Business Activity, Employment—all seasonally adjusted—and Supplier Deliveries.
A reading above 50% implies that the non-manufacturing arm of the economy is generally improving. This is a positive/bullish sentiment for the U.S. Dollar.
A reading of less than 50% indicates the non-manufacturing sector is generally dwindling, and implies a bearish sentiment for the Dollar.
Traders can anticipate a bullish sentiment for the USD as the most recent data released February 05 shows that the actual reading is 55.5, while the previous reading is 54.9, and the forecast reading is 55.0.
USDSGD Price Analysis
USDSGD Long term Outlook: Bullish
Monthly Chart

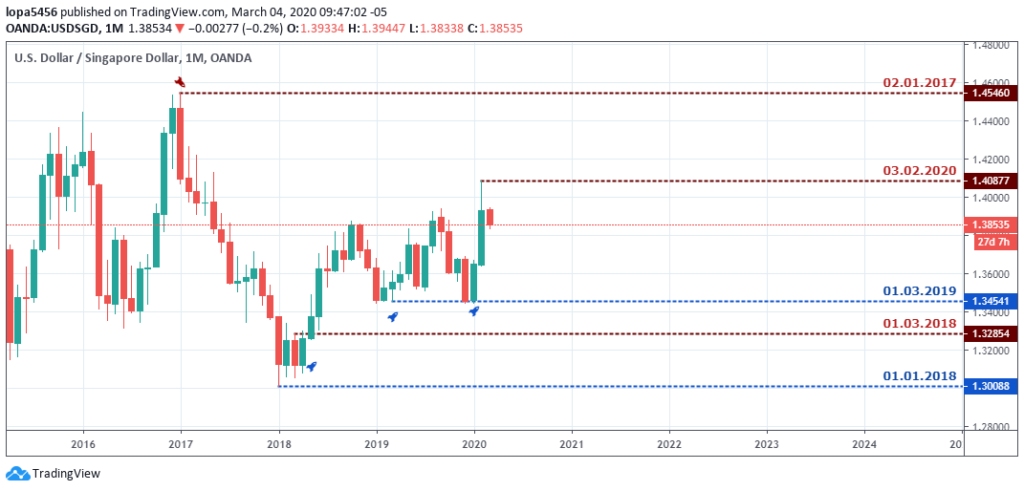
The double bottom chart formation on the 1.34541 support led to a massive gain in strength for the Greenback and setting a new all-time high at 1.40877.
At the opening of the month, traders start to take profits from their two-month long-position leading to a correction of the bullish price surge and short term strength for the Singapore dollar.
Weekly Chart

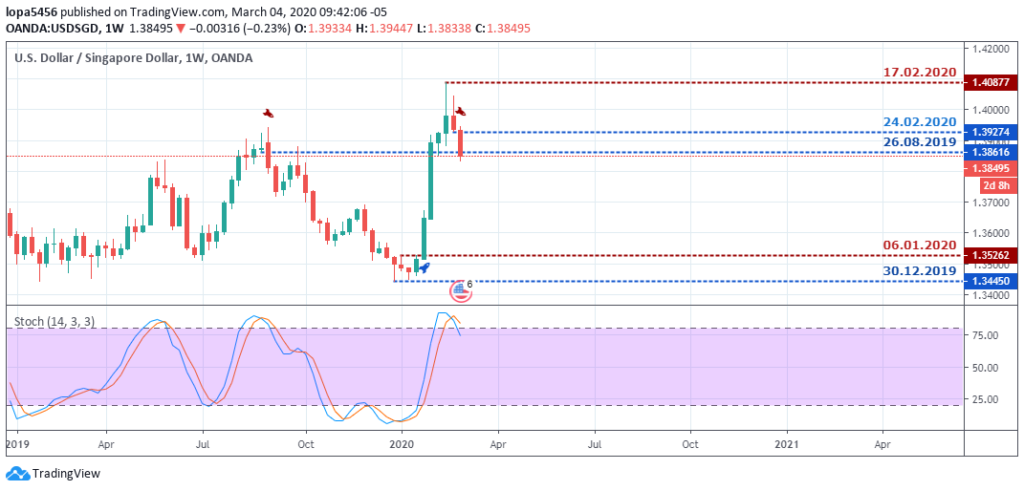
An inside-bar candlestick pattern signaled on 24 Feb 2020 showed a slowing and correction of the bullish trend that last for five weeks in a row.
The breakdown of inside-bar support (1.39274) is enough to bring the USDSGD out of the overbought area from where we can expect a further slump in favor of the Singapore dollar.
USDSGD Medium Term Outlook: Bearish
Daily Chart

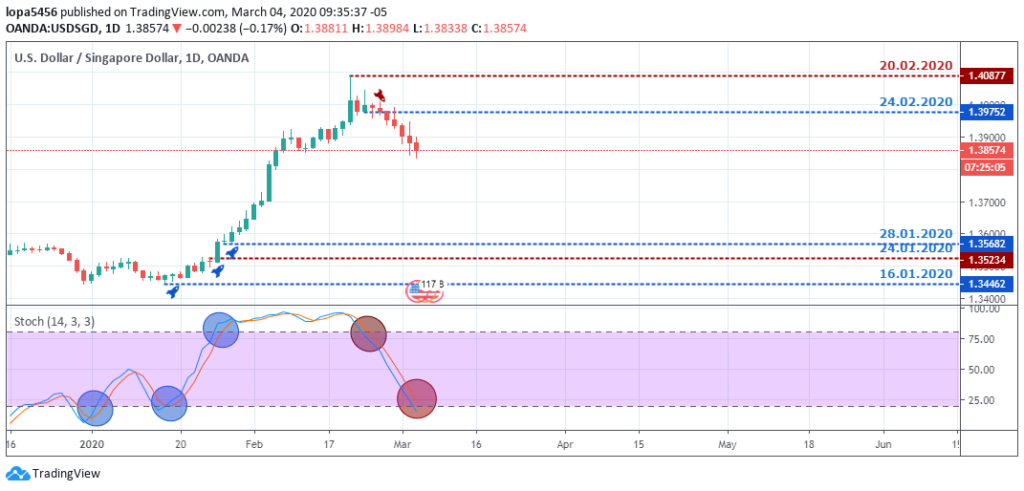
A collapse of hidden bullish support on 24 Feb 2020 saw the USD to SGD exchange rate resume a series of bearish closing bars and enters the oversold region.
The %k and %D of the stochastic oscillator will have to exit the oversold area for us to see a bullish take over in the coming weeks.
H4 Chart

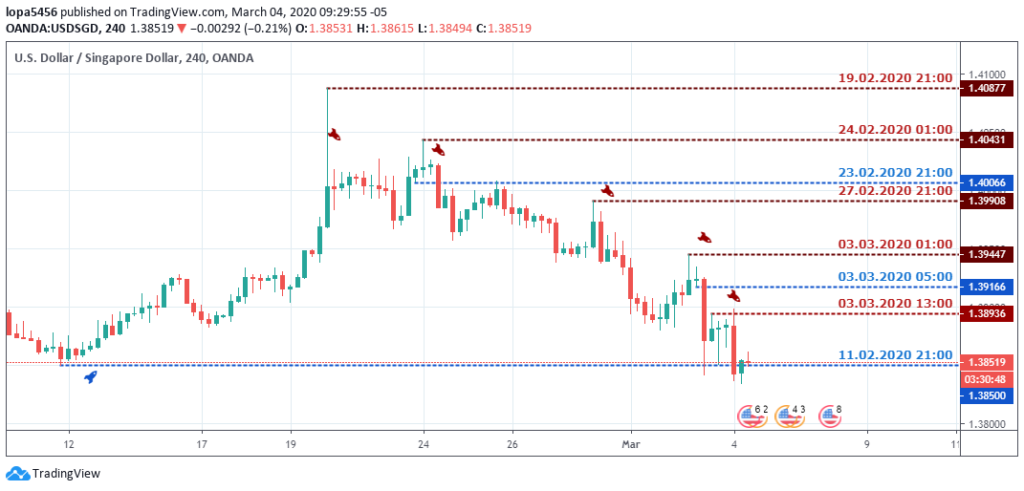
All attempts to restore the bullish trend was cut short by an increase in selling pressure breaking through support areas on 23 Feb 2020 21:00 and 03 Mar 2020 05:00.
The price slump continued lower breaking below the 11 Feb 2020 21:00 support with no clear sign of a reversal.
Conclusion
The Singapore dollar attempts recovery from the five weeks bashing by the USD at the start of the new month. Our analysis concludes the current price drop of the USDSGD foreign exchange to be a mere correction of the gains, to resume later the price rally in the remaining half of March.

- EURUSDWeekly outlook – 7th January 2022 - January 7, 2022
- BTCUSD – Weekly outlook for Bitcoin Price – 23rd December 2021 - December 24, 2021
- USDSGDWeekly outlook for Singapore Dollar – 17th Dec 2021 - December 17, 2021

