USDSGD Technical Analysis for Singapore Brokers
Contents
Introduction
The Singdollar shows a steady increase in strength against the USD on all Singapore brokers.
This week, we analyze the significant technical patterns moving the USDSGD exchange rate, as well as recent macroeconomic events in both economies.
Singapore Unemployment Rate
The Unemployment Rate is a measure of the total number of unemployed members of the workforce who are actively seeking employment.
Traders can expect a bearish sentiment when the released data is higher than anticipated, and a bearish sentiment if the published data is less than forecasted.
Traders can expect a bullish trend for the USD as proven by the latest release on October 25, which shows the actual reading to be 2.3%, while previous reading read 2.2%.
U.S. Unit Labor Costs
Unit Labor Costs, which is a major pointer to consumer inflation, measures the change in the amount businesses pay for labor annually. It excludes data from the farming industry.
Traders can expect a bullish trend when the released data is higher than anticipated, and a bearish trend if the published data is less than forecasted.
Traders can expect a bullish trend for the USD as proven by the latest release on December 10, which shows the actual reading to be 2.5%, previous reading to be 3.6%, and the forecast data to be 3.3%.
The United States Core Consumer Price Index
The Core CPI is an evaluation of changes in the price of goods and services, except food and energy. The assessment, which is based on the consumer’s perspective, is a key indicator of evaluating changes in purchasing trends and inflation.
Traders can expect a bullish trend when the released data is higher than anticipated, and a bearish trend if the published data is less than forecasted.
Traders can expect a bullish trend for the USD as proven by the latest release on November 13, which shows the actual and forecast reading to be 0.2 %, and the previous reading to be 0.1%.
USDSGD Technical Analysis
USDSGD Long term Projection: Bearish
Monthly Chart

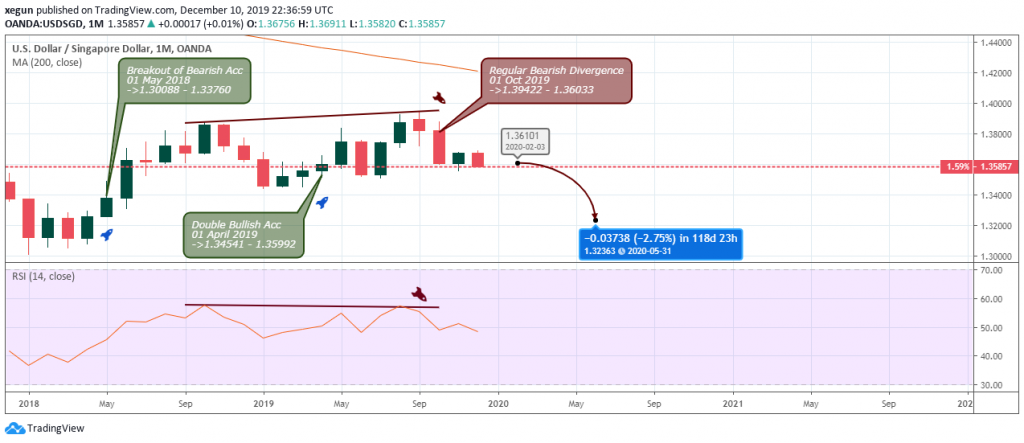
To begin with, the USDSGD approached the 200-monthly Moving Average area where it couldn’t advance any further, held back by some kind of repelling field, and eventually transitioned into a regular bearish divergence pattern on October 01, 2019.
We move lower to the weekly chart, where we get a confirmation into the divergence.
Weekly Chart

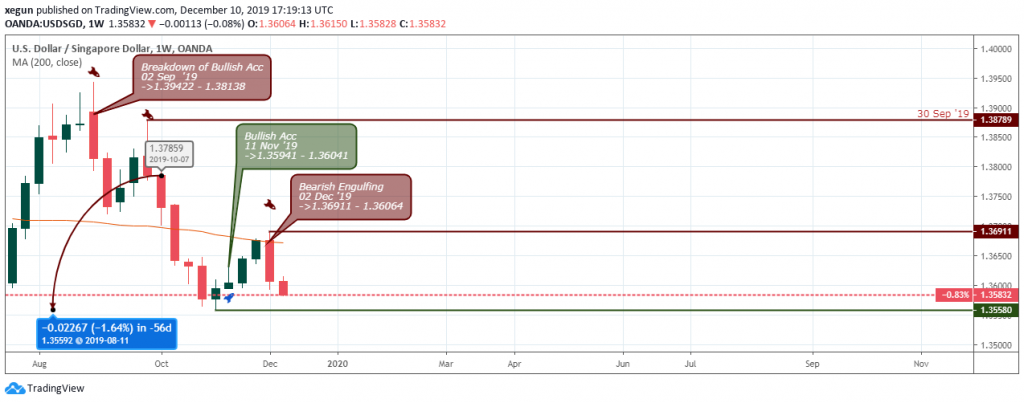
Let’s turn to the weekly chart of the USDSGD where the bears closed the USD to SGD exchange rates below the 1.38616 support, and later plummets by about 1.64%.
Attempts to restore the price above the 200-period Moving Average failed, as the Moving Average bounced the USDSGD foreign exchange back in the bearish direction to favor the Singdollar.
USDSGD Medium Term Projections: Bearish
Daily Chart

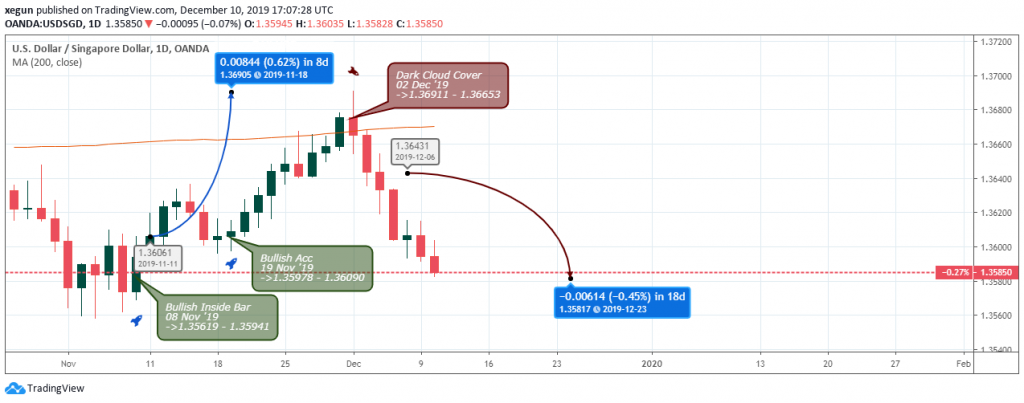
Similarly, a view from the daily time frame reveals the USDSGD stopped in its track by the 200-daily Moving Average, confirmed by a dark cloud cover candlestick pattern on December 02, 2019.
The price plunged by roughly 0.45% after an earlier 0.62% increase from a bullish inside-bar pattern on November 11, 2019.
Conclusion
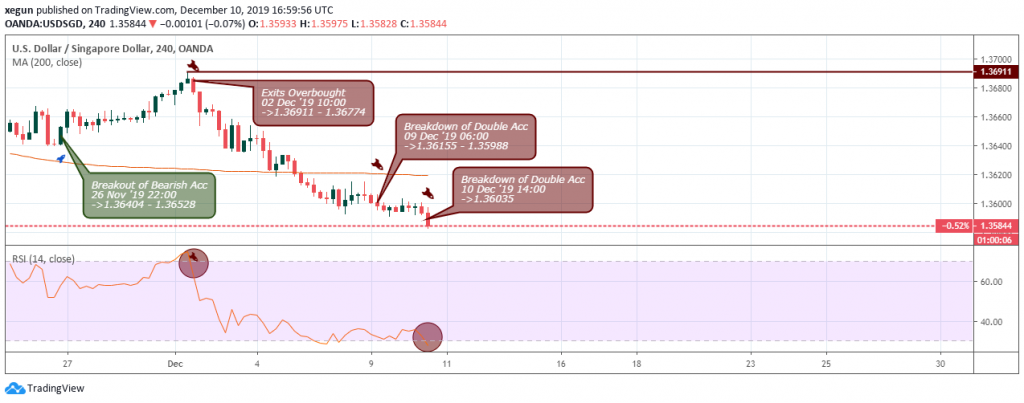
The Singapore dollar dominates the greenback, this time closing below the MA-200 from above, coming out of the overbought territory on December 02 at 10:00.
H4 Chart: Bearish

While the pair now trades in the oversold area starting from December 10, 14:00, we expect further price slump towards the 1.35619 support area.
From a long-term perspective, the pair is projected to complete a 2.75% drop from the current low.

- EURUSDWeekly outlook – 7th January 2022 - January 7, 2022
- BTCUSD – Weekly outlook for Bitcoin Price – 23rd December 2021 - December 24, 2021
- USDSGDWeekly outlook for Singapore Dollar – 17th Dec 2021 - December 17, 2021

