USD/SGD Weekly Analysis for Singapore Brokers
Contents
Introduction
The Singdollar made a comeback starting from August 16, as traders and investors anticipate positive sentiment in the economy.
Asia/Singapore Fundamentals
Over the period of 2 weeks, Asian investors lowered their short-sell trades on Asian currencies, as indicated by a Reuter poll, following a weakening dollar and rising investor optimism over Sino-U.S trade talks. The Singapore economy grew slower than estimated following a flagging of moderation in growth.
Weekly Chart of the Singapore 30

Taking a look at the weekly chart of the Singapore 30 shown above, a bearish regular divergence sends the stock south as a breakout of bullish accumulation is formed around the same zones as the divergence pattern. The share price trades below the 65-period moving average as a sign of weakness. A further close below the trend line signal further short selling and a probable weak Singapore economy.
Daily Chart of the Singapore 30
Still on the Singapore 30 stock chart, although the prices are shorting in the long term, the daily chart shows a slight glimpse of recovery through the triggering of breakout out the pattern of both bearish and bullish accumulation patterns.
Technical
USDSGD: Monthly Chart

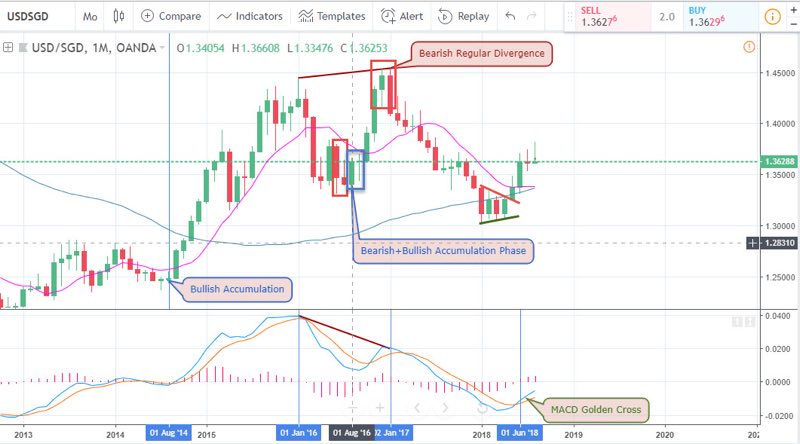
Let’s do a quick rollback on the oscillatory path the USDSGD pair has been on, starting from a bullish accumulation on 01 August 2014 to a divergence pattern that sends the pair tumbling down. This bearish move continued till a breakout of an alternating accumulation phase on 01 Jun 2018, which can also be seen through a MACD golden cross pattern. The exchange rate begins to slow as the MACD oscillator moves towards the zero level.
USDSGD: Weekly Chart

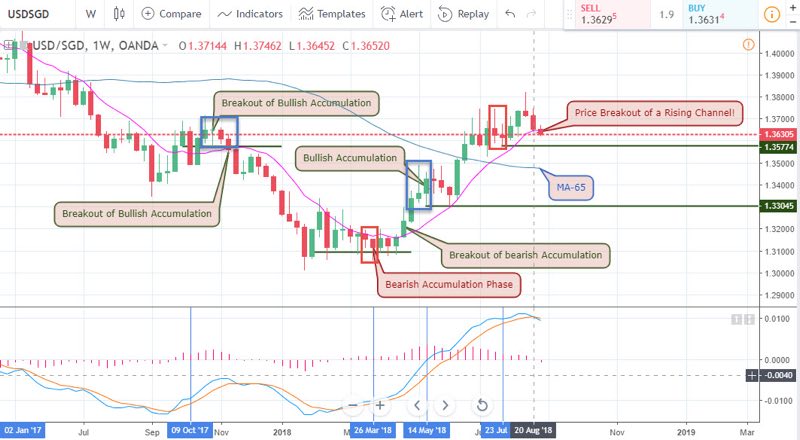
The above weekly chart shows a breakdown of the monthly charts time series, indicating a breakout of a bullish price action patterns that lead to majorly consecutive bearish candles from 09 October 2017 till 26 March 2018. The bearish accumulation pattern failed to huge buying pressure causing the pair to soar high in a bullish trend. A breakout of bearish accumulation pattern at the peak of a bullish trend is mostly approached with low risk and caution; with this, in mind, we’ll only take trades if the opportunity presents itself at the 1.35774 support level.
USDSGD: Daily Timeframe

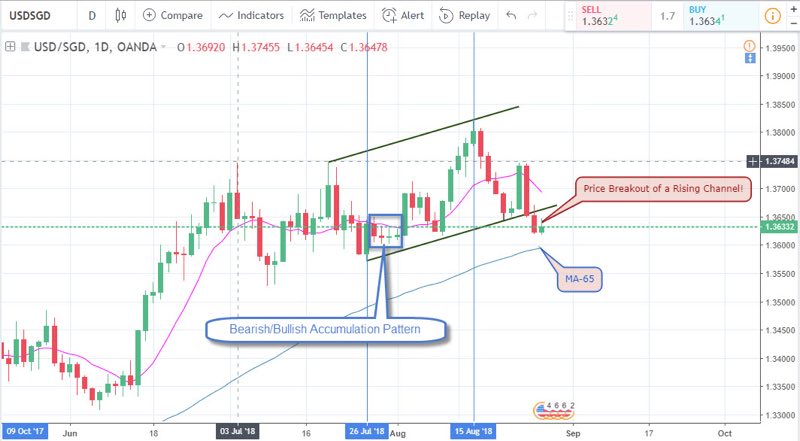
A view of the above daily chart shows a more oscillatory pattern of the U.S dollar vs the Singdollar. The pair just broke out of a rising equidistant channel, indicating a recovery of the Singapore economy. Only time will tell if the pair does not break through the 65-period moving average.
USDSGD: 4-HOURLY Timeframe
The 4-hour chart is where we get a clear weekly overview. Going back to the last post we made on this pair, we highlighted the significance of the bearish regular divergence pattern on the 15th of August. A triple bearish accumulation pattern followed the divergence pattern pointing strongly towards a more bearish market direction. Well, it all turned out as we pictured it as price plummets into a series of majorly bearish closing candles. Price later broke out of the bearish accumulation pattern and moved deeply into the bearish trend.
The pair later nosedive into another series of bearish closing candles after it made a high of 1.37466.
USDSGD: 2-Hour Chart
After going through the 4-hour chart, you’ll notice that there was no price action pattern that could have given us the slightest hint of the price drop after the high of 1.37466. Scrolling a bit deeper to the 2-hourly chart gives a clue on how that happened. A double bearish accumulation pattern was formed at the peak, followed by another breakout of a bullish accumulation pattern. Most recently, a breakout of a bearish accumulation pattern is triggered on the 28th of August, which may lead to a weakening of the SGD to USD exchange rate.
Projection and Conclusion
As some Singapore broker/s and traders are planning to short the pair following the fundamental optimism, we, on the other hand, will rather go Long on the pair in anticipation of a bullish divergence pattern. On the other hand, a price close below the 1.36192 support level would signal short selling.
Our Recommended Singapore Broker to trade USD/SGD
Best Regulated Broker: IQ Option

IQ Option is the world’s leading EU regulated financial broker based with a revolutionary platform for all traders. Very popular for crypto and USD/SGD trading. Read IQ Option Singapore review
- Best Trading App for Binary Options
- Minimum Deposit of only $10
- Minimum Trade of $1
- Trusted Broker
- $10,000 Virtual Funds ( Demo Account )
- Quick Withdrawals
- Outstanding Platform
- Weekly Tournaments
- Gain up to 98%*
Best Binary Options Broker: Olymp Trade

Olymp Trade is an award winning binary options broker with an excellent trading platform support and education tools. Read Olymp Trade Review
- Risk-Free Trades
- Minimum Deposit of only $10
- Max. 90% Payout
- $10,000 Free Demo account
- Free TrainingEducation : 18 Indicators, 7 strategies and 28 webinars 25% Deposit s
- Certified Platform
- Quick withdrawals
Best Binary Bonus: Binomo

Binomo is a regulated binary broker with a wide range of assets to trade and amazing promotions ( bonus, tournaments prizes,..) .Read Binomo Review
- 25% Deposit Bonus ( 100% Bonus VIP accounts )
- Minimum Deposit of only $10
- Minimum Trade of $1
- Max. 95% Payout
- $1,000 Virtual Funds ( Demo Account )
- Weekend trading
- Free training
DISCLAIMER

- EURUSDWeekly outlook – 7th January 2022 - January 7, 2022
- BTCUSD – Weekly outlook for Bitcoin Price – 23rd December 2021 - December 24, 2021
- USDSGDWeekly outlook for Singapore Dollar – 17th Dec 2021 - December 17, 2021
Tagged with: usdsgd

