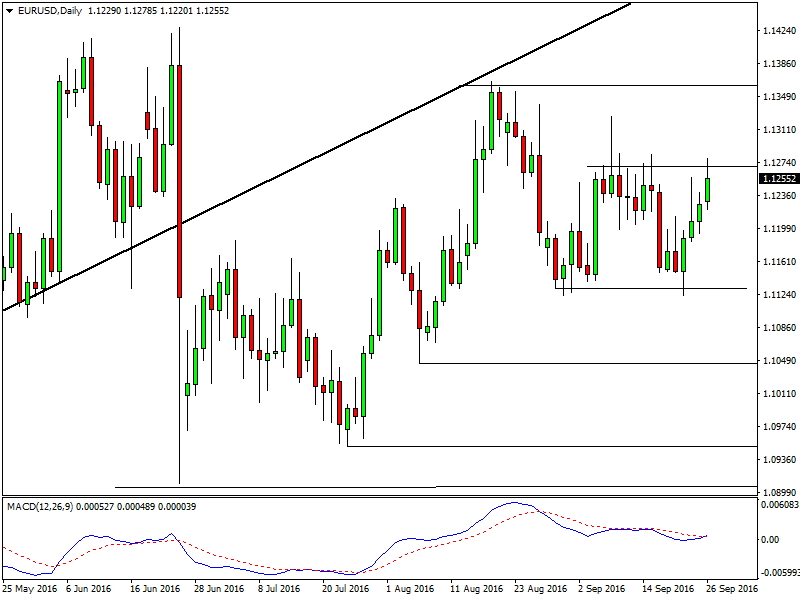
Daily timeframe
Contents
EURUSD continues to trade sideways and last week it formed a double bottom instead of accelerating to the downside. We have drawn all the horizontal support and resistance lines on this daily chart and we have a nicely defined range that EURUSD is trading in at the moment. This 140 pips box-range is from 1.1130 to 1.1270. Further to the upside at 1.1360, we have a previous high and therefore resistance. Below the box-range, support is at 1.1045.
The lines of the MACD indicator are close to each other, confirming that there is no trend on this chart. So, it’s best traders to continue trading the EURUSD with range-trading strategies as the sideways price action is likely to stay with us for some time.

EURUSD Daily chart – It’s best to trade the range in this environment
4h timeframe
Again, here too, we have a range. In fact, it’s a close up view from the same range we saw on the daily chart. Here it’s worth noting how the RSI indicator picked the tops and bottoms with high accuracy. If you look closely you’ll see every time the RSI value went to 30 or 70, a bottom or top was formed in the price of EURUSD.
The weekly and monthly pivot points also coincide with several horizontal support and resistance lines thus strengthening them.
1h timeframe
The 1h chart is particularly interesting this time because the price action seems so revealing. First, notice the divergence in the last two upswings and the readings of the RSI indicator marked with the two blue lines (this divergence is also evident on the 4h chart). It’s important that this bearish divergence doesn’t occur in the middle of anywhere on the chart, but right at a firm resistance area. This combination is a strong bearish signal.
Further, even just by looking at naked price action in the last two upswings we can notice that the first upswing is much steeper and faster than the last. This is also a bearish signal because it indicates that the bulls are slowly losing momentum in the market.
Two options to sell for traders.
- Sell at current levels around 1.1250 with a stop above the weekly resistance 1 (red line on the chart).
- Wait for a downside break of the trendline and sell after it occurs. This is always the safer option as it confirms the reversal but also the trader is more likely to miss out on a bigger part of the move.
Our Recommended Binary Options Brokers to trade EURUSD:
Best Regulated Broker

IQ Option is the world’s leading EU regulated broker based with a revolutionary platform for all traders. Read IQ Option Review
- Best Trading App for Binary Options
- Minimum Deposit of only $10
- Minimum Trade of $1
- Trusted Broker
- $10,000 Virtual Funds ( Demo Account )
- Quick Withdrawals
- Outstanding Platform
- Weekly Tournaments
- Gain up to 98%*
Best US Broker
- They accept US clients
- 1-Hour Withdrawal
- Paypal & AMEX Accepted
- $1 Minimum Trade
- Huge Bonuses
- Highest Returns
- Weekend Trading
- Free Education
- EURUSDWeekly outlook – 7th January 2022 - January 7, 2022
- BTCUSD – Weekly outlook for Bitcoin Price – 23rd December 2021 - December 24, 2021
- USDSGDWeekly outlook for Singapore Dollar – 17th Dec 2021 - December 17, 2021


